Test- FTSE 100 Kicks Off August on a High as BP and Senior Lead Market Momentum
$11
10 Oct 2025, 13:13
Neutral
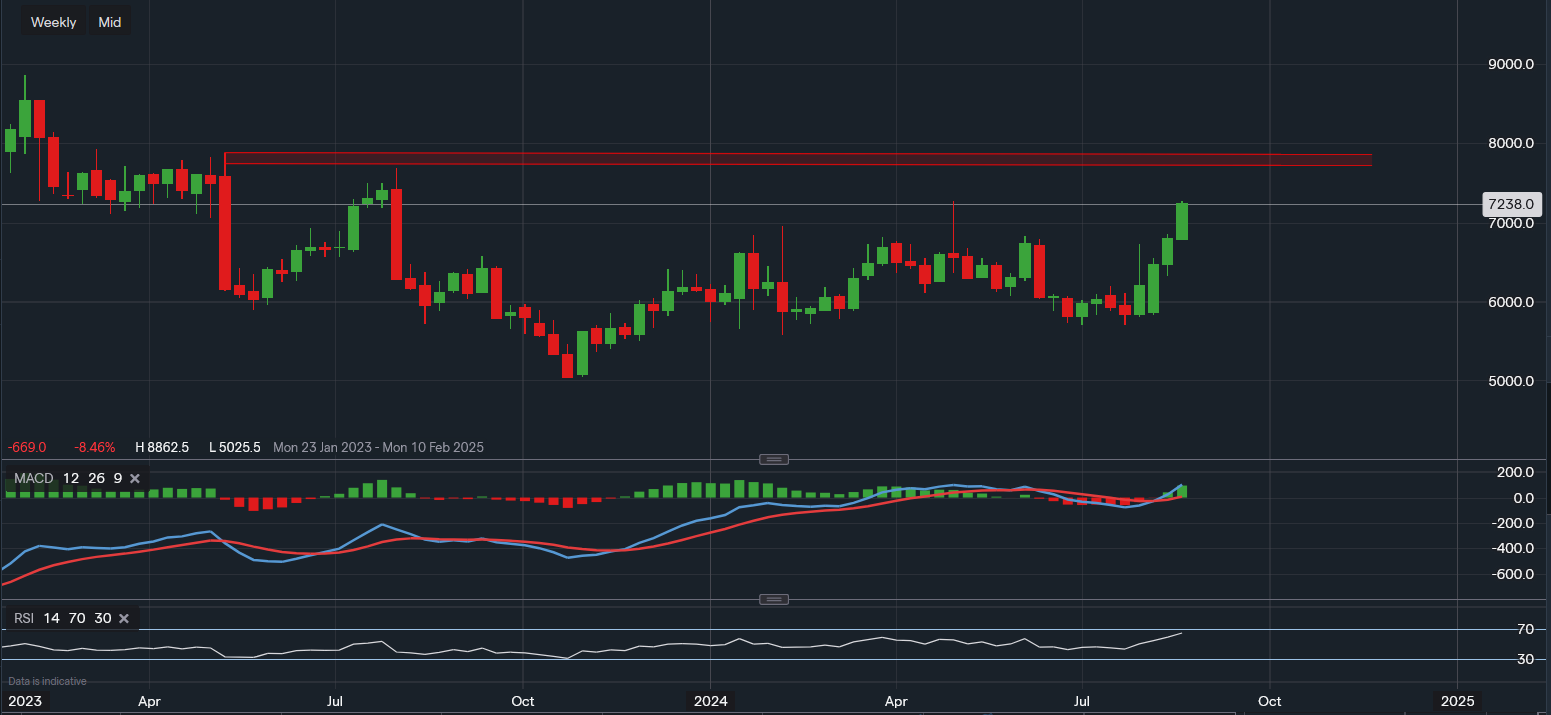
Chart & Data from IG
Taking a look at PayPal as it seems to have caught some momentum over recent weeks. After failing all year to move the resistance between $70-$73, it is once again at this point where traders will be watching the price action closely. Currently trading at around $72.38 a share, we know a move above $72.75 would likely invite some buyers but still, eyes would primarily remain on the key resistance between $76.93-$78.78. A break above $78.78 would be the first major sign for possibly longer-term gains for investors and some well-needed recovery. The support near term is around $68-$69 a share as this was the previous area of resistance, which has now flipped to support. A break below here may then shift the focus towards $61.12, although this would likely create further concerns and potentially lead to an increase in volatility. Nonetheless, the technical indicators are looking positive once again. The MACD has crossed back above it signal line and the RSI reads 65, supporting the current momentum.

Tradable assets:
Min.Deposit:
Max Leverage:
FCA:

Rating:


