Test- FTSE 100 Kicks Off August on a High as BP and Senior Lead Market Momentum
$11
10 Oct 2025, 13:13
Neutral
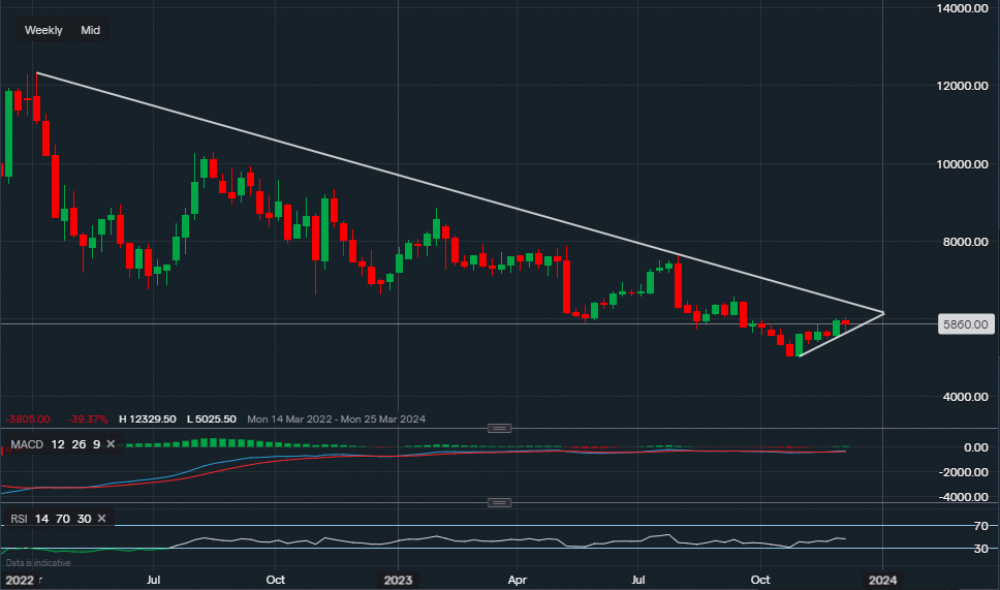
Chart & Data from IG
PayPal still trading within the downward trend but it seems like the tech stock may be gearing up to test the resistance once again. This is more visible on the daily chart shown below. Currently, the stock’s share price is trading at around $58.60 a share. We can see a minor supportive trendline has formed as it was tested on the 28th of November and once again earlier today. So far, the price has managed to bounce back after the test. The support along the trendline reads $56.37, a move below would first require a test of the $55.05 level before any lower support levels are outlined. The minor resistance for PayPal here is the level of $60.38, a break and close above this level would then allow the bulls to look towards the major resistance along the descending trendline. The resistance along the trendline reads $63.80-$64. Based on the technical indicators, the bias is moderately bullish, the MACD is still positive with a medium volume and the RSI is positive as it reads 57.
 (Chart & Data from IG)

Tradable assets:
Min.Deposit:
Max Leverage:
FCA:

Rating:


