Test- FTSE 100 Kicks Off August on a High as BP and Senior Lead Market Momentum
$11
10 Oct 2025, 13:13
Neutral
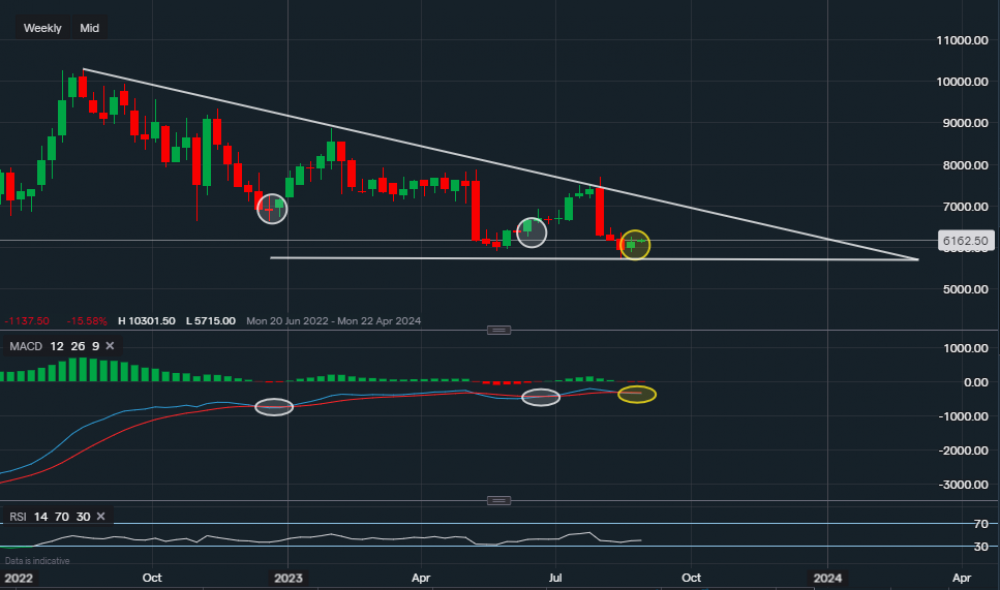
Chart & Data from IG
Taking a look at PayPal before going into September, we can see that resistance on the weekly continues to overpower the momentum with the stock’s price then heading lower. Currently, its trading at around $61.62 a share. The price is based within the descending triangle drawn on the chart, having now created a new support level of $57.17 (lower trendline). A break below this level could see the price continue lower towards the mid-high $50s. However, if we look at the history of the chart and the MACD indicator, we can see that after each fall the price has consolidated before bouncing higher. This is highlighted by the white ovals along the MACD, and we have highlighted the current MACD level with a yellow oval. Our preference is to wait in order to see more consolidation and see the MACD turn positive before looking for a move back towards the trendline resistance. Trendline resistance is now at $69.67. Finally, the RSI is reading 40, suggesting a negative to flat outlook.

Tradable assets:
Min.Deposit:
Max Leverage:
FCA:

Rating:


