Test- FTSE 100 Kicks Off August on a High as BP and Senior Lead Market Momentum
$11
10 Oct 2025, 13:13

Chart & Data from IG

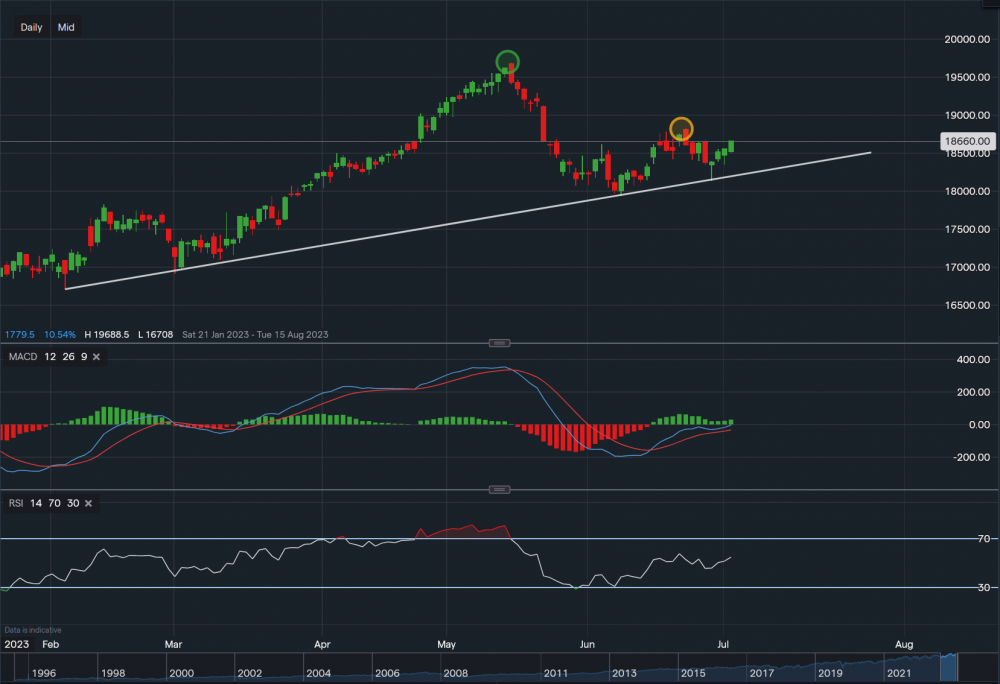
Taking a look at PepsiCo as it is reporting quarterly earnings next week (Thursday 13th). From a technical outlook, we can see that the price is currently trading at around $186.60 a share. Based on the daily timeframe, the support is clear and has been created along the ascending trendline. A key support level was created on the 29th of June at $181.34, which is along the trendline. The price since has bounced and is now approaching a level of resistance sitting at $188.32 (yellow oval). A break and close above this resistance level would open the possibility of a move higher, with the targets then of $192.21 and then maybe a push back up towards the all-time high at $196.88 (green oval). However, a negative report could ruin this setup. Support levels are currently sat at $184.19 then at $182.81 (trendline) and then the key of $181.34. A break and close below the key support level could then see a retracement even lower towards $179.33. Looking at the technical indicators, MACD is still slightly positive and RSI has just turned positive as it reads 54.7. PepsiCo is expected to report earnings of $1.95 a share on revenue of $21.71 billion.