Test- FTSE 100 Kicks Off August on a High as BP and Senior Lead Market Momentum
$11
10 Oct 2025, 13:13
Neutral
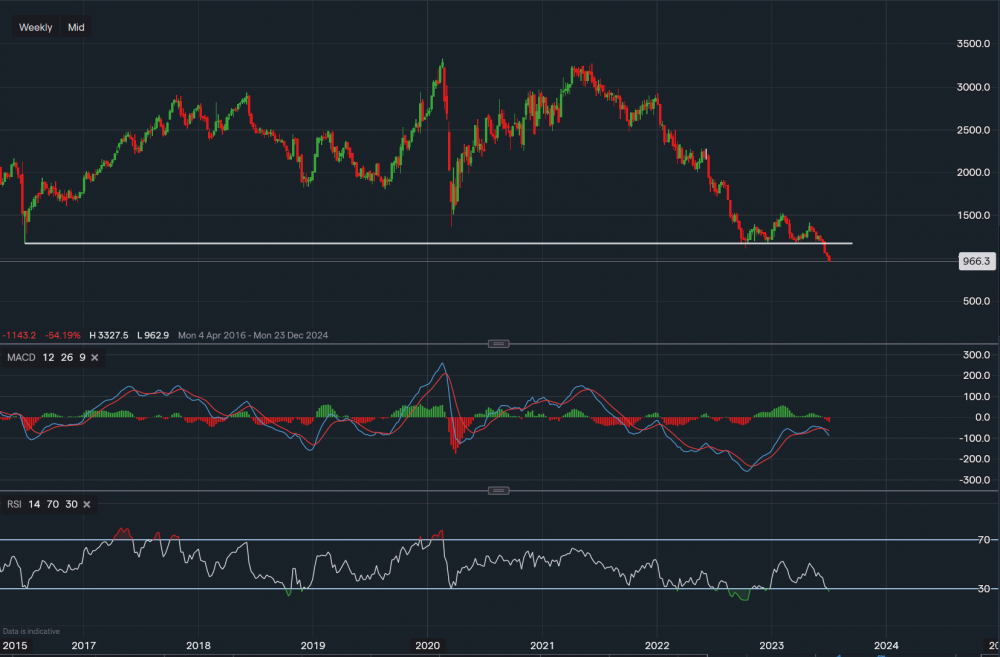
Chart & Data from IG
From a technical outlook, the price has just broken through the key level of support on the weekly timeframe. The support was sitting along the trendline at 1.170p, it is now approaching a further level of support at 1.044p. A break below 1.044p could see the price decline even lower towards 8.00-9.00p a share. The previous key level of support is now acting as resistance (1.170P), this is only if we see some consolidation around the current levels. If this was the case and a break above 1.170p occurred, we then would look towards resistance at 1.393p. However, from a technical perspective at this moment in time, this is less likely. Looking at the technical indicators, MACD has turned negative and RSI remains negative. Both indicators are suggesting that selling momentum is overpowering and is likely to continue, especially after the break below the key support level.

Tradable assets:
Min.Deposit:
Max Leverage:
FCA:

Rating:


