Test- FTSE 100 Kicks Off August on a High as BP and Senior Lead Market Momentum
$11
10 Oct 2025, 13:13
Neutral
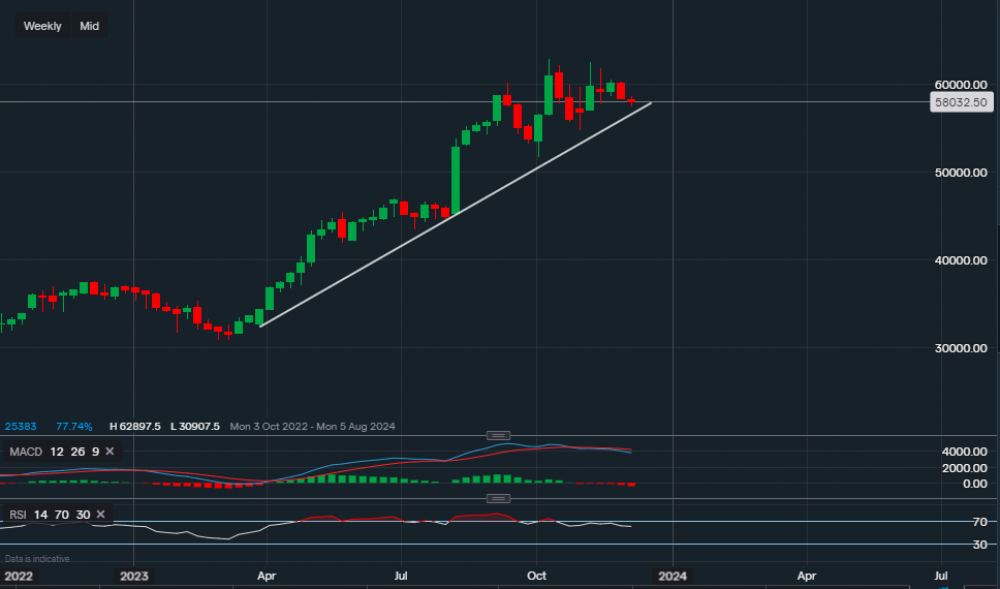
Chart & Data from IG
Taking a look at the pharma companies that have entered the obesity drug battle. Eli Lilly and Novo are currently the leading competitors, but earlier today Roche has a made move by acquiring Carmot as part of their strategy to enter the market. First up is Eli Lilly, currently its shares are trading at around $580.32 a share. From a technical viewpoint, we can see that the price continues to trade above the supportive trendline dating back to March of this year. However, we can see that recently it has struggled to overcome the resistance of $628.87, creating a lower high by closing around $600.82 at the back end of November. Its price has fallen slightly since then, now approaching the support along the trendline that reads $565.88. A break below this support level would not necessarily mean that a bearish trend has now formed but it does increase the likelihood of a further decline. With the following support levels sitting at $547.73 and then $516.68. In Minipip’s opinion, the bias has now shifted to neutral/bearish until the resistance of $628.97 is broken as the recent drug hype has boosted the stock. The technical indicators support our outlook as the MACD on the weekly interval has now turned negative, with the MACD line below its signal line. The RSI is still positive though it has faltered a little as it reads 61.
According to Yahoo Finance – Eli Lilly currently trades at 47.8x forward earnings.
Over to Roche, the company’s shares sit around $261.00 a share right now. From a technical aspect, it could be argued that a potential breakout is in play as we can see an engulfing candlestick on the weekly timeframe. A close above the descending trendline may be the indication for possibly a rally higher, especially after the news released earlier. However, this is not guaranteed and investing/trading based on news can be of high risk as false breakouts do occur regularly. Nevertheless, we will highlight the key resistance and support zones. The resistance Roche faces now sits at $276.90 followed by $284.20. A move above $284.20 could lead to an extension towards $298.60, a level seen in July earlier this year. On the other hand, towards the downside, the key and only support is the base highlighted by the horizontal trendline. The base support reads $245.40, a break below this level could perhaps lead to a new all-time low. If we look at the technical indicators, we can see that the MACD has now actually turned positive, but the week isn’t over just yet. The RSI was suggesting oversold conditions but has now wiggled its way out, still negative as it reads 39.
According to Yahoo Finance – 11.8x forward earnings
 (Chart & Data from IG)
The final firm is Novo Nordisk. The Danish Pharma giant is currently seeing its shares trade around $100.48 a share. Some analysts on Wall Street are claiming that its drug ‘Wegovy’ stands a good chance of performing highly, in turn, favouring the stock. Looking at the chart, its shares haven’t fallen drastically the company just decided to undergo a stock split. Its share price since the split has risen just over 11%, with the resistance now sitting at $105.67. A close above this level would then allow investors to look further with the next target between $110-$115. The support below reads $96.01 then $92.92 and then $86.96. A break and close below $86.96 would be a bearish signal and could perhaps see a move even lower towards around $80 a share.
According to Yahoo Finance – Novo currently trades at 31x forward earnings.
 (Chart & Data from IG)

Tradable assets:
Min.Deposit:
Max Leverage:
FCA:

Rating:


