Test- FTSE 100 Kicks Off August on a High as BP and Senior Lead Market Momentum
$11
10 Oct 2025, 13:13
Neutral
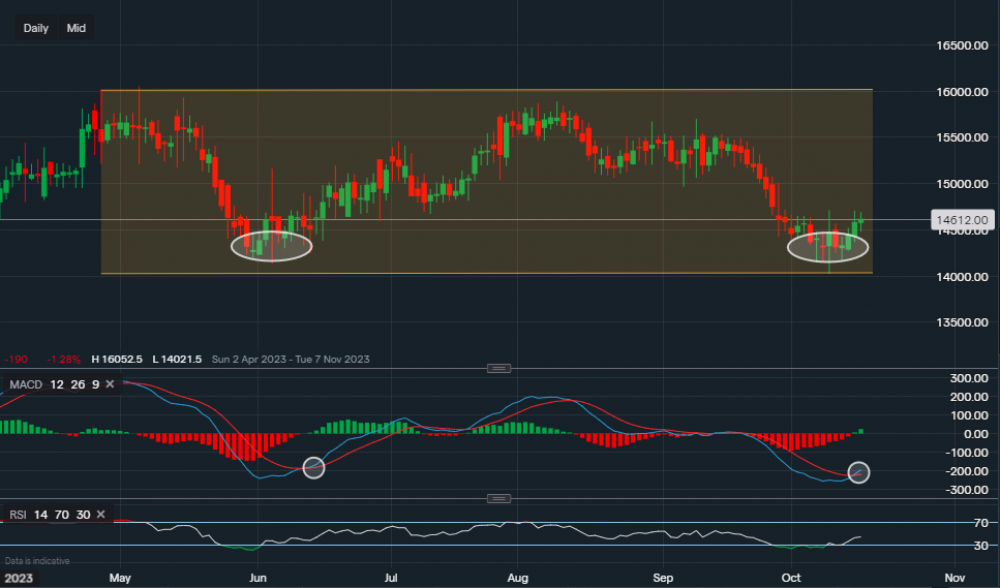
Chart & Data from IG
PG’s shares are trading at around $146.12 a share. Looking at the daily interval, we can see its share price has been trading within the channel drawn on the chart since the 26th of April. The attempt to push higher on the 9th of August was rejected, which led to the leg back down towards the lower zone of the channel. Although, the support of $141.33 was upheld and now the price seems to have consolidated. If look deeper with regards to the technical aspect, when a similar scenario occurred previously (June) after the price consolidated, the MACD line crossed above the signal line and the price pushed higher. We can see that yesterday the MACD crossed above the signal line once again, which is a bullish indication. However, it is not guaranteed that a rise towards similar levels will happen again, so investors/traders should be cautious if adding any positions. To summarise, a break below the support of $141.33 could see the price head lower and move out of the channel towards the downside. On the other hand, a positive earnings report with a positive MACD may see the price rise higher with the closest resistance point of importance at $148.96. The RSI now reads 44.

Tradable assets:
Min.Deposit:
Max Leverage:
FCA:

Rating:


