Test- FTSE 100 Kicks Off August on a High as BP and Senior Lead Market Momentum
$11
10 Oct 2025, 13:13
Neutral
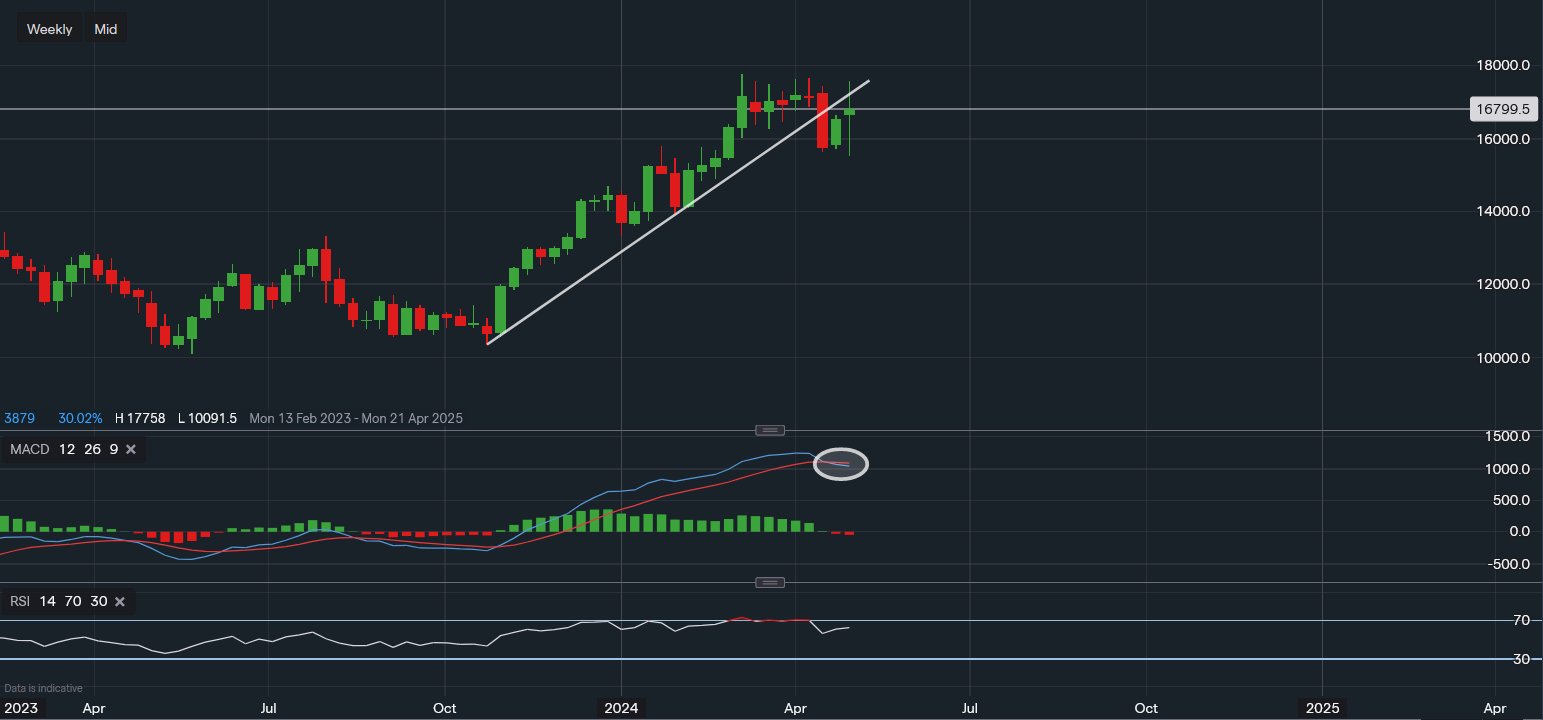
Chart & Data from IG
Taking a look at Qualcomm ahead of its earnings call tomorrow. Currently, its shares are trading at around $167.99 in the pre-market session. Looking at the weekly chart, the trendline support has now been broken which is a bearish indication, suggesting the momentum is stalling as well as some profit-taking due to a cautious approach. However, it seems like a new support level at $156.19 was created with a bounce higher that followed. The earnings will most likely be the next catalyst here for QCOM in the near-term. A break below $156.19 could spark a sell-off towards $140, but a move and close back above the trendline, would position the stock back near the highs of the year ( $175-$176). If a break above the highs occurs then this would certainly pave the way for an extension towards the all-time highs of $190-$195. Nonetheless, a factor that is noteworthy here is the position of the technical indicators. Even though the MACD and RSI are both lagging indicators, they also present signs of momentum change. We can see that over the past couple of weeks, the MACD line has crossed below its signal line, which is a bearish signal. However, the RSI is positive and slightly rising after last week’s bounce higher. Therefore, the outlook is a bit of a mixed bag heading into earnings. Creating more of a gamble rather than a technical approach. Hence, in such scenarios, it could be argued that the following approaches might be better:

Tradable assets:
Min.Deposit:
Max Leverage:
FCA:

Rating:


