Test- FTSE 100 Kicks Off August on a High as BP and Senior Lead Market Momentum
$11
10 Oct 2025, 13:13
Neutral
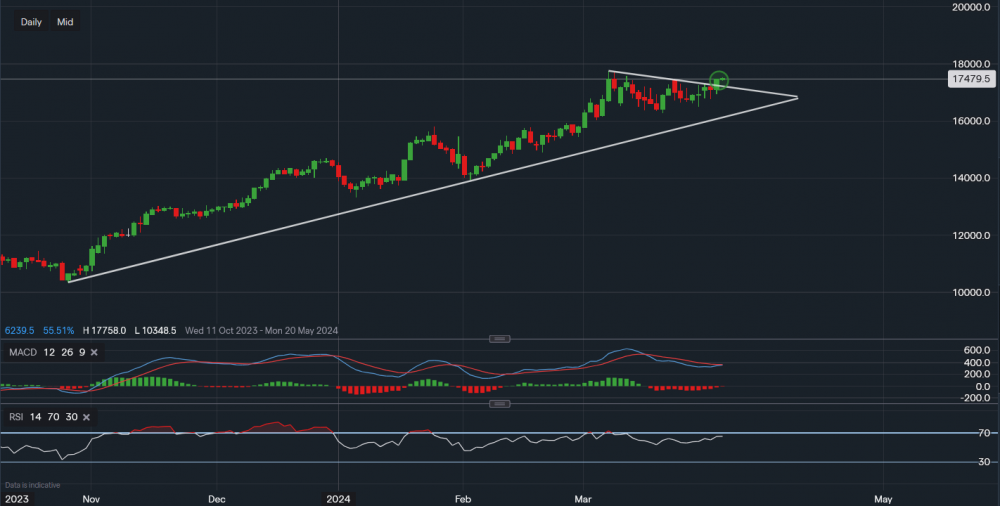
Chart & Data from IG
Seems like a potential breakout towards the upside for Qualcomm here on the daily chart. Currently, its shares are trading at around $174.74 a share. Yesterday’s session closed above the upper trendline resistance, however, it still faces resistance points at $175.78 and then $177.58. Only a close above $177.58 will increase the likelihood of any further upside in the short-mid term. In that scenario, investors could then target the area of $180-$185. With the company’s earnings due later in the month, we may see increased volatility as well as some side movements ahead of the earnings call. The previous trendline of resistance has now turned to support, with the support reading $172.11 (along the trendline). A move back below the trendline would suggest some caution ahead of the earnings, with the price potentially pulling back towards the key trendline support (lower trendline). Although, there are other levels providing additional support, such as $167.57 followed by $165.00. Looking at the technical indicators, the MACD is negative but looks like it may turn positive once again. Whereas the RSI has remained positive as it reads 65.

Tradable assets:
Min.Deposit:
Max Leverage:
FCA:

Rating:


