Test- FTSE 100 Kicks Off August on a High as BP and Senior Lead Market Momentum
$11
10 Oct 2025, 13:13
Neutral
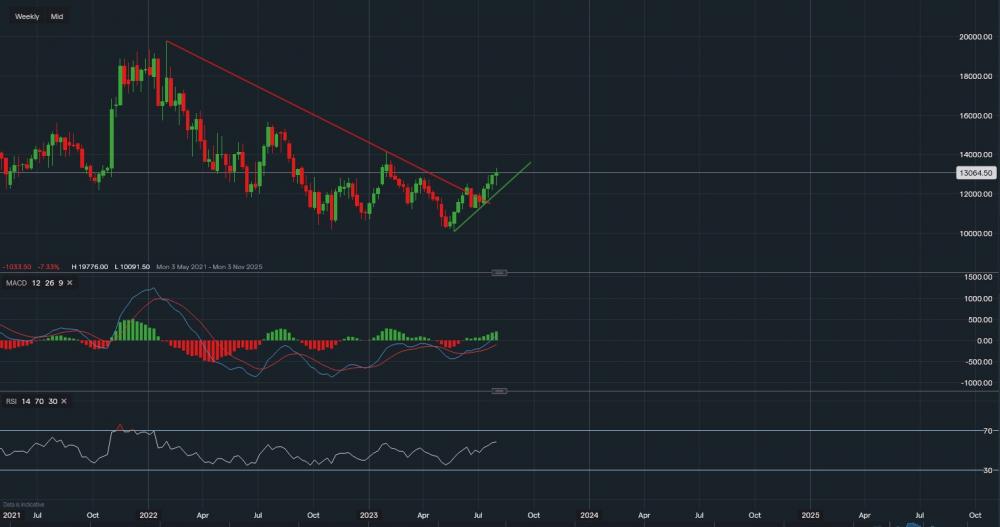
Chart & Data from IG
QUALCOMM is currently trading at around $130.64 a share. Similar story to our two most recent posts on Occidental and PayPal, broken out of the bearish trend on the weekly interval on the week commencing July 10th. It has continued to rise ever since, now heading for its fourth consecutive green week. This is another player that is reporting earnings tomorrow, which is why Minipip is analysing this company. QUALCOMM is a software company that creates semiconductors, for those who were not sure of the industry. It is also a constituent of the NASDAQ100. Support below sits along the green trendline at $122.10, it would require a heavy selloff for this to be hit (approx. 6%). Nevertheless, it could happen and so if it did we would then look at support at $119.32 followed by $114.29. On the other hand, towards the upside, resistance can be found at $137.37 followed by $141.74. $141.74 can be classed as a key level because a break and close above it would create a good entry point for a move towards $150 by the end of the year. Of course, this is not guaranteed and investors/traders should not use the above prices as entry points within their own portfolio, as this is all speculation. Looking at the technical indicators, MACD is positive with strong volume and the RSI has now turned positive as it reads 58.


