Test- FTSE 100 Kicks Off August on a High as BP and Senior Lead Market Momentum
$11
10 Oct 2025, 13:13
Neutral
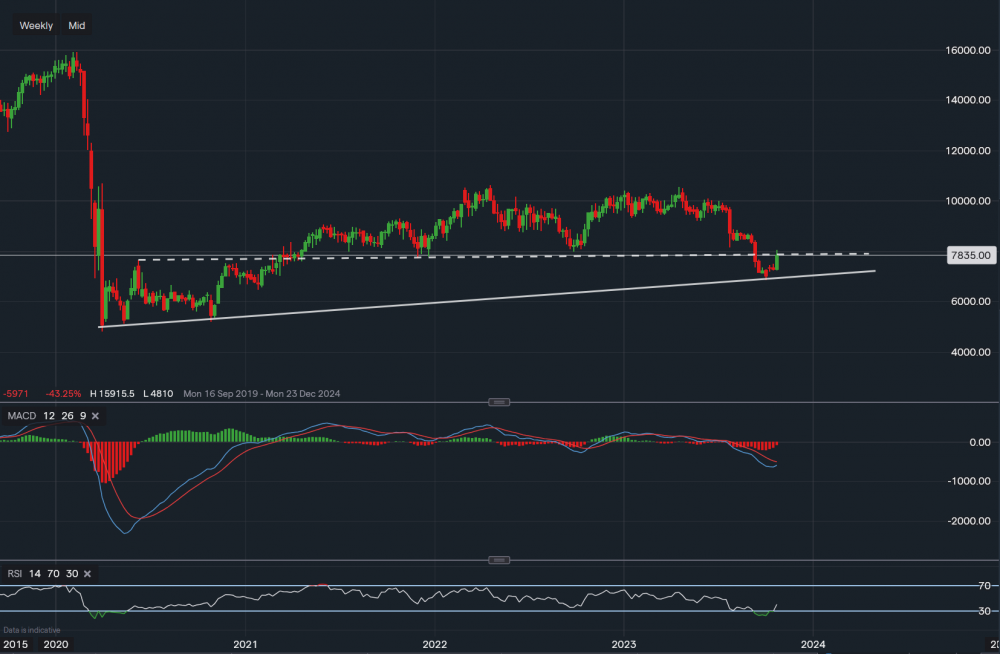
Chart & Data from IG
Taking a look at Raytheon as the defence arms company was up 8% at the US open, now trading at around $78.35 a share. We can see its price has fallen below the support levels formed back in December 2021 and October of last year. With the current Middle East conflict it seems like this stock may have found some motivation with buyers rushing in. We can see this week’s candle stick is so far coming across as an engulfing candlestick, resistance now sits at $76.50 (highlighted by the dotted trendline). A break and close above the trend may create some support for the stock with then a potential push towards $82-$83. The conflict duration in the Middle East may have some key influence over the upcoming weeks. We can see the key support now sits along the trendline dating back to the Covid pandemic lows, with the support along the trendline reading $69.60. A break below would indicate a potential move towards the peak COVID levels. Looking at the technical indicators, the MACD is yet to turn positive but the volume has now lowered and the RSI has climbed out of the ‘oversold’ territory as it reads 39. Though still negative.

Tradable assets:
Min.Deposit:
Max Leverage:
FCA:

Rating:


