Test- FTSE 100 Kicks Off August on a High as BP and Senior Lead Market Momentum
$11
10 Oct 2025, 13:13
Neutral
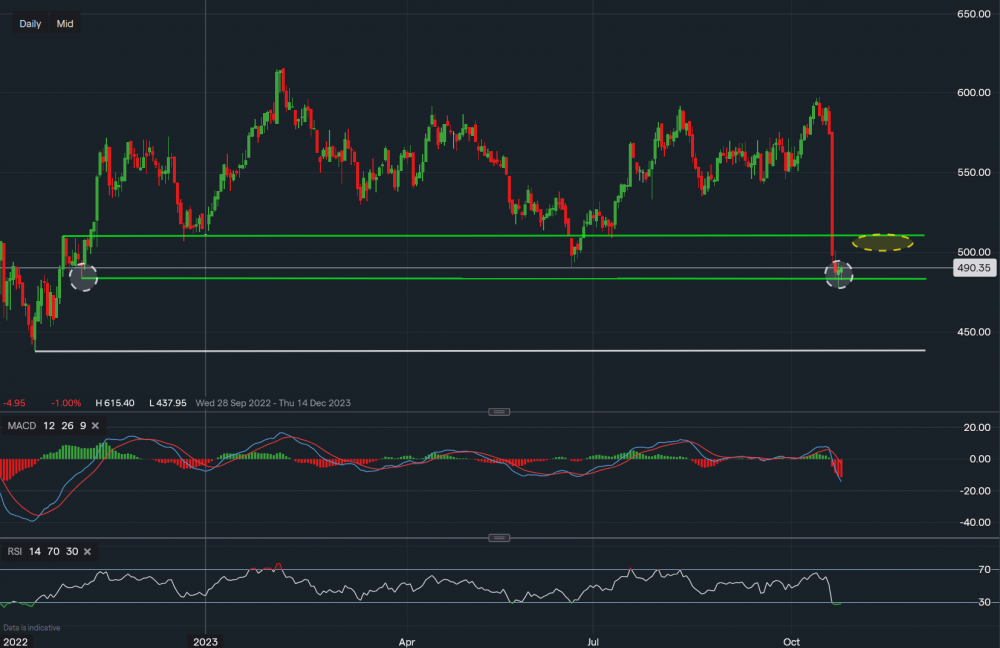
Chart & Data from IG
Taking a look at Rightmove after its heavy fall over the last couple of days. Currently, its stock price is trading at around 490p a share, we can see the price has fallen in the area zone within the channel visible on the chart. The price has tested the support of 483p and now seems like it is trying to consolidate (ovals). Upon completion of consolidation, we may see a bounce higher towards the upper trendline of the channel as this was the previous key support level, which is now acting as resistance. This is marked by the yellow oval where the price could potentially test the resistance. A break below the lower trendline of the channel would suggest further downside pressure, perhaps leading to a move lower towards the white trendline where the next support level sits at 437p. The technical indicators are heavily pointing to more downside as the MACD volumed has enlarged significantly and the RSI reads 28. However, the RSI suggest the stock is now somewhat ‘oversold, and even though both are lagging indicators, the MACD can react slower than the RSI and vice-versa.

Tradable assets:
Min.Deposit:
Max Leverage:
FCA:

Rating:


