Test- FTSE 100 Kicks Off August on a High as BP and Senior Lead Market Momentum
$11
10 Oct 2025, 13:13
Neutral
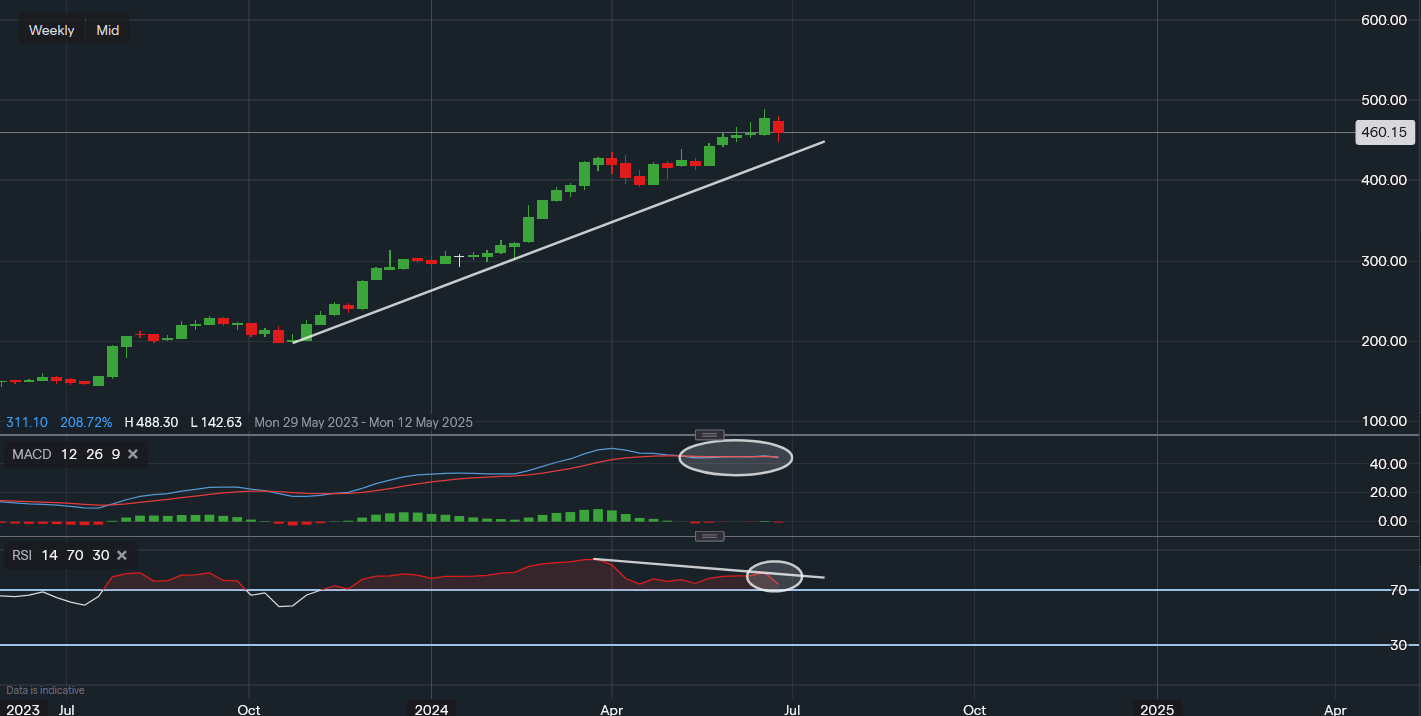
Chart & Data from IG
Taking a look at Rolls-Royce as signs of the steam running out are becoming more apparent. Currently, the LSE listed stock is trading at around 460p a share. Up 55% YTD, it may continue higher as we can see past drawdowns have not been too drastic, for example in April, but it is worth noting that the technical indicators are now suggesting strong overbought conditions. The weekly chart shows us the stocks have found resistance around 488p, also the all-time high and some profit-taking is now taking place as this week is on track for its first down week in 6 weeks. The support here for investors is the level of 448p (this week’s low), followed by trendline resistance of approximately 434p. The trendline support should act as the more robust one out of the two if that price is to head that way. A break below the trendline could spark a further sell-off, shifting the attention to 411p, 402p, and 392p in the short term. In theory, the stock remains in a bull trend, so a move above the resistance of 488p would create 500p as the next psychological resistance for traders. However, the indicators point toward a bearish bias. The MACD has now been flat and in an overbought position for around 8 weeks, meanwhile the share price kept rising. Additionally, the RSI is potentially forming a bearish divergence and as highlighted it’s suggesting overbought, reading 75.

Tradable assets:
Min.Deposit:
Max Leverage:
FCA:

Rating:


