Test- FTSE 100 Kicks Off August on a High as BP and Senior Lead Market Momentum
$11
10 Oct 2025, 13:13
Neutral
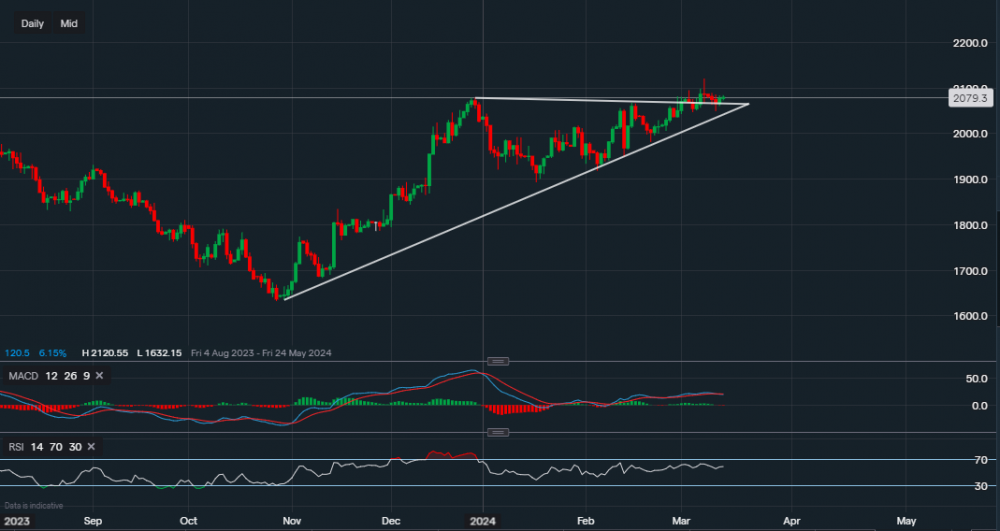
Chart & Data from IG
Taking a look at the Russell it can be argued that it is lagging compared to the rest of the market. Currently, the index is trading at around 2,079. Looking at the daily chart, we can see the index tried breaking higher after moving above the resistance but soon lost momentum. It has now pulled back towards the previous resistance line, which is now acting as support. Some markets have a tendency of breaking past a resistance point, which absorbs more traders, and then head in the opposite direction (testing the new support – previous resistance). Before actually continuing in the direction of the breakout. This is of course not guaranteed and false breakouts occur, however, we can see that on Tuesday the sellers tried to force the index lower but it managed to close just along the supportive trendline. In yesterday’s session, we saw a re-test with a close above Tuesday’s open, this suggests bullish momentum. Hence, it will be interesting to see how the Russell reacts after the US retail data is due later in the day. The key support here reads 2,064 followed by 2,049. Whereas the resistance is now at Friday’s high of 2,120. Looking at the technical indicators, they are slightly mixed. The MACD has only just dipped below its signal line but the RSI is positive as it reads 58. It is worth noting that technical indicators are more sensitive on smaller timeframes and do not always provide an accurate indication of price movements.

Tradable assets:
Min.Deposit:
Max Leverage:
FCA:

Rating:


