Test- FTSE 100 Kicks Off August on a High as BP and Senior Lead Market Momentum
$11
10 Oct 2025, 13:13
Neutral
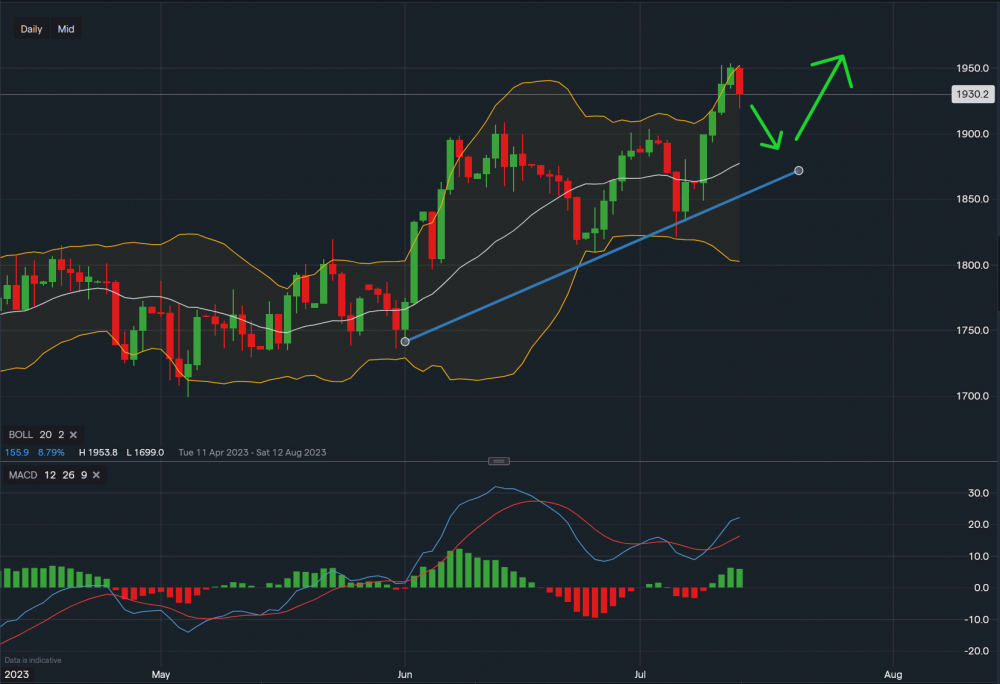
Image Data IG
The US-based index, Russell 2000 had a strong week last week however the index looks slightly overbought as RSI read 69 on Thursday with the index moving out of the upper Bollinger bands on both the weekly and daily timeframe. A pullback would be welcome however as it could signal another possible entry point for investors and traders as the market grinds higher.
Looking at the chart, support for the index sits at $1,877, followed by trendline support at $1,860. A break and close below here however could suggest further downside or a more netural tone in the short term. Given we are now in earnings season each one of the 2000 constitutes will likely be reporting earnings and therefore the market will be volatile.
Towards the upside, a drop in the index followed by volume and a move higher would be incredibly bullish. Resistance sits at $1,949 with a break above here possibly indicating a move higher towards $2000 in the coming week/two.


