Test- FTSE 100 Kicks Off August on a High as BP and Senior Lead Market Momentum
$11
10 Oct 2025, 13:13
Neutral
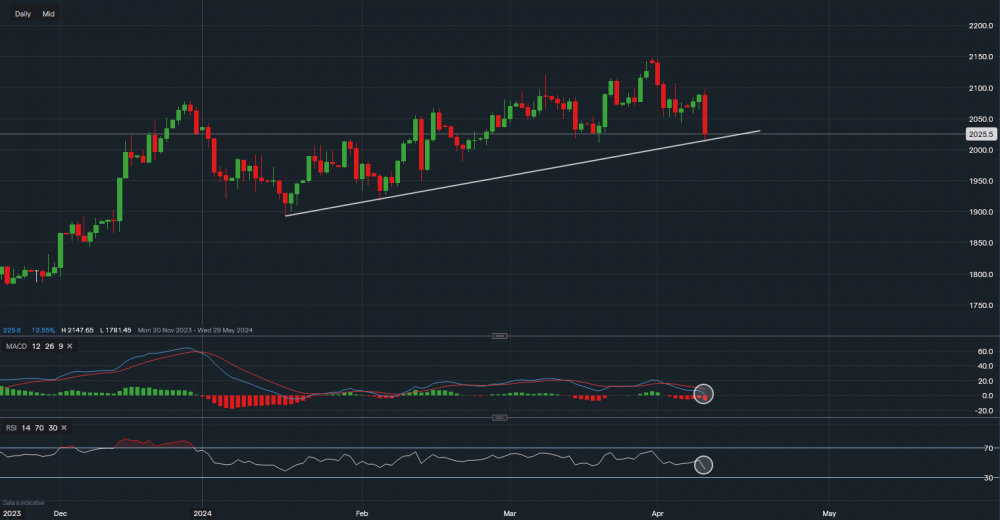
Chart & Data from IG
Taking a look at the Russell 2000 index after the most recent CPI print. Currently, the index is trading at around 2,025 and down almost 3% in the pre-market session. Based on the daily chart, we can see that the index has now approached an important support level here, testing the trendline support of 2,012. A break and close below the trendline would indicate bearish momentum, increasing the likelihood of a further sell-off. This would shift the focus towards 1,981 and maybe even 1,948. However, buyers may rush in here for a short-term bounce off the trendline. In that scenario, the resistance in focus would be the area of 2,054-2,066. Nonetheless, it is vital to note that the near-term bias may now shift bearish, especially after the hotter-than-expected inflation data over in the US. Hence, further declines cannot be ruled out. Additionally, the technical indicators have also turned negative. The MACD volume is enlarging and the RSI now reads 40, caution should remain.

Tradable assets:
Min.Deposit:
Max Leverage:
FCA:

Rating:


