Test- FTSE 100 Kicks Off August on a High as BP and Senior Lead Market Momentum
$11
10 Oct 2025, 13:13
Neutral
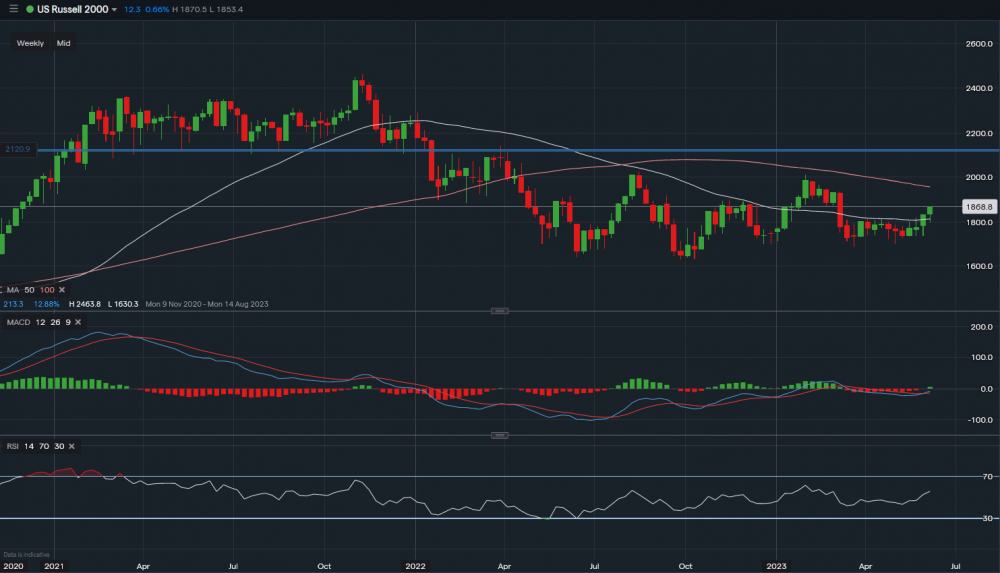
Russell 2000 - Chart data from IG
The Russell 2000, an index that tracks 2000 midcap companies in the USA, is currently up 4 weeks in a row and could continue the rise higher. Looking at the chart, MACD has just turned positive with RSI reading 56. Tough resistance above sits at the 100 SMA at 1,956. A break above here could then see the index move toward the 2022 highs. Towards the downside support now sits at 1,813 (50 SMA) followed by 1,800. The 50 SMA has moved 3pts higher per week over the past 3 weeks showing signs of an uptrend forming. A break below 1,800 however could see the market retrace back towards 1,650 where then the index continues to sit in its long-term range.

Tradable assets:
Min.Deposit:
Max Leverage:
FCA:

Rating:


