Test- FTSE 100 Kicks Off August on a High as BP and Senior Lead Market Momentum
$11
10 Oct 2025, 13:13
Neutral
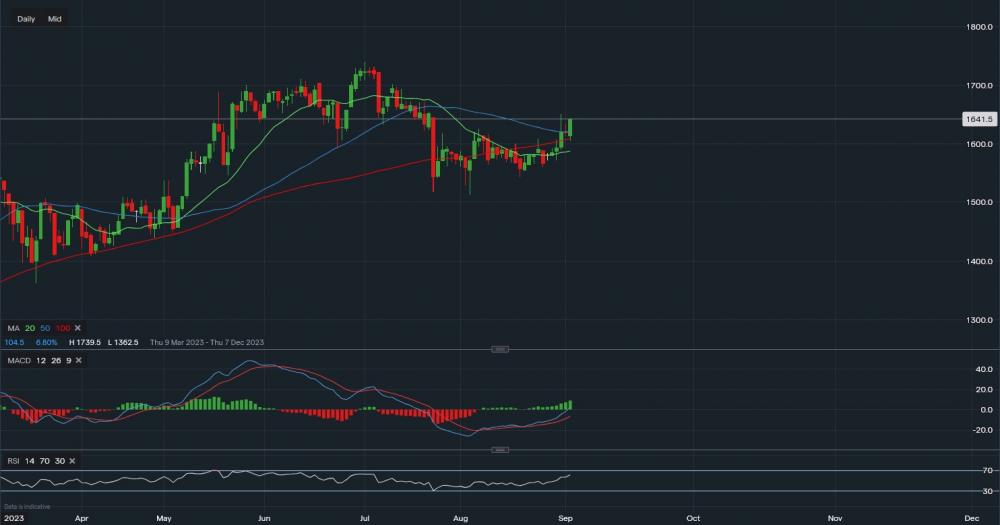
Chart & Data from IG
Ryanair’s stock currently trading at around €16.41 a share. Looking at the chart based on the daily interval, we can see that the price underwent a retracement, testing the 100-day moving average and forming a support base just below it. The level of the support base reads €15.12, a break below this key level could see the price continue lower towards €14.48. This would suggest that the correction is not over yet. On the other hand, since the support has been established, the price has now risen above all 3 moving averages. A close today above the 50-day MA may indicate that a further upside move is upcoming, hence, resistance sits at €16.51 (Thursday’s high), then at €16.71. A break above €16.71 could even see a push back up towards the €17 a share level. Over to the technical indicators, both are positive with the RSI reading 61. Airlines remain in a strong position to perform well this year, following increased demand compared to last year.

Tradable assets:
Min.Deposit:
Max Leverage:
FCA:

Rating:


