Test- FTSE 100 Kicks Off August on a High as BP and Senior Lead Market Momentum
$11
10 Oct 2025, 13:13
Neutral
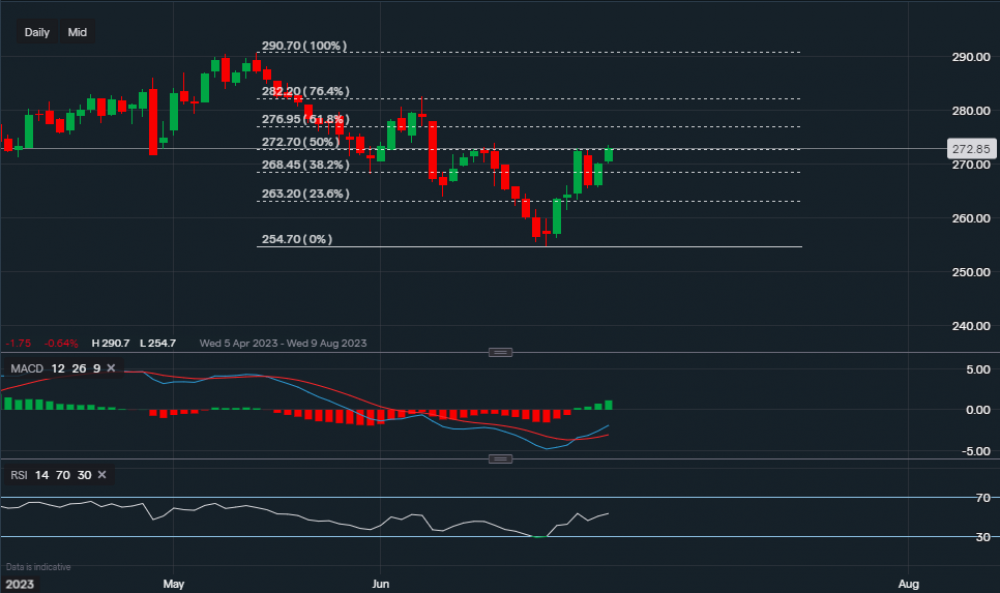
Chart & Data from IG
Taking a look at Sainsbury's as the British grocer is scheduled to report its earnings tomorrow. Currently, its share price is trading at around 272p a share, applying the Fibonacci retracement to the chart, we can see that its price has now approached the resistance level sitting at the 50% Fib. Which is also the current share price. A break and close above the 50% Fib could see the price rise higher towards 276p (61.8% Fib) and even 282p (76.4% Fib). Towards the downside, the first level of support sits at 268p (38.2% Fib) and then at 263p (23.6% Fib). A dip and close below 263p may see the price fall lower towards the key support level sitting at 254p. Taking a look at the technical indicators, MACD is positive and the RSI is neutral-positive as it reads 53.
Note: investors/traders should be cautious when entering as the outcome of the earnings may have an influence on the price. In theory, a positive report should see the price rise whereas a negative could see the price fall. But this is not guaranteed.

Tradable assets:
Min.Deposit:
Max Leverage:
FCA:

Rating:


