Test- FTSE 100 Kicks Off August on a High as BP and Senior Lead Market Momentum
$11
10 Oct 2025, 13:13
Neutral
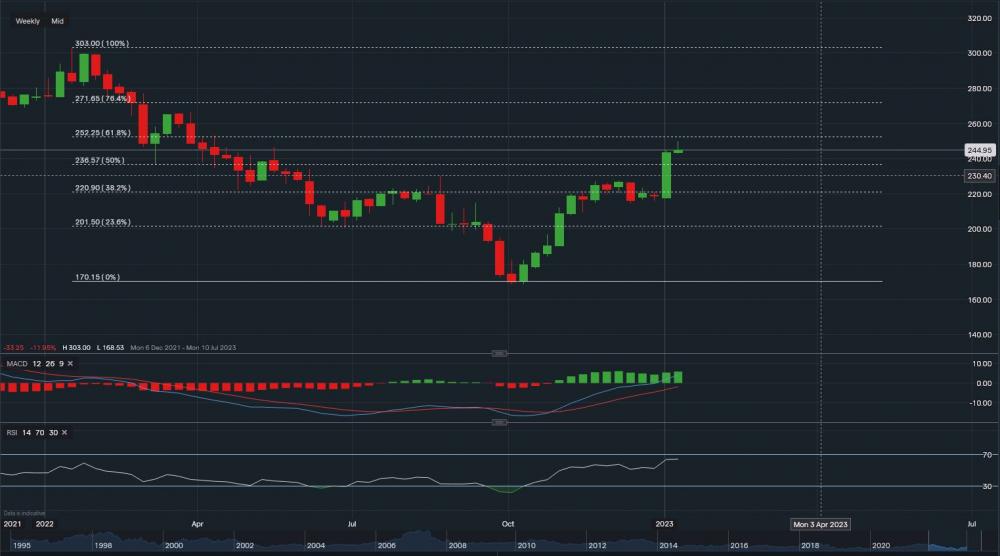
Sainsbury's - Chart & Data from IG
Overview
J Sainsbury plc, doing business as Sainsbury's, is the second-largest chain of supermarkets in the UK, accounting for 14.6% of all supermarket sales in the country as of September 2022. J Sainsbury plc, the holding company, is divided into three segments: Argos, Sainsbury's Bank, and Sainsbury's Supermarkets Ltd. (which includes convenience stores). The national wealth fund of Qatar, known as the Qatar Investment Authority, owns 14.99% of the business as of 2021, making it the largest individual stakeholder. A component of the FTSE 100 Index, it is listed on the London Stock Exchange.
Financials
Sainsbury's reported £854m statutory profit before tax in 2022 versus a loss of £164m in the 2021 financial year. Retail operating profit grew 36.9% on the prior year and retail sales grew 3.4%, leading to an increase of 117% on the earnings per share to 25.4p. Additionally, the company managed to generate an 8.4% return on capital employed, which was up 280bps from the previous year. Furthermore, total assets rose by £1.7bn and total liabilities were in fact reduced by £70m, creating an increase in total equity of £1.7bn YOY. However, cash and cash equivalents did fall by £658m.
Technicals
From a technical overview, Sainsbury’s stock is currently trading at around 244.95p a share. Applying the Fibonacci retracement to the chart, resistance above sits at 252.25p (61.8% Fib) then at 271.65p (76.4% Fib) then a key level at 303p (100% Fib). A break above the 100% Fib could see the stock’s price rise towards the highs of 2021, where the price reached a level of 341p a share. Towards the downside, support sits at 236.57p (50% Fib) then at 220.90p (38.2% Fib) then at 201.50 (23.6% Fib). A break below the 23.6% Fib may see the price fall towards the lows of 2022 and the key level at 170.15p. Looking at the technical indicators, MACD is currently positive and so is RSI as it reads 64.
Summary
Overall, the financials of Sainsbury’s demonstrate strong progress year-on-year and the earnings have been on the positive side of the spectrum in 2022 versus 2021. Its cash and cash equivalents did fall significantly compared to 2021, but the business continues to operate on a good level with a healthy balance sheet as shown above. Based on the technicals of the stock, the bias is bullish for the longer term and both indicators currently confirm this. The Fibonacci retracement levels are acting as support and resistance, and these are highlighted above. Note: Sainsbury's is due to report some financial earnings tomorrow, this may have an influence on the price of the stock.

Tradable assets:
Min.Deposit:
Max Leverage:
FCA:

Rating:


