Test- FTSE 100 Kicks Off August on a High as BP and Senior Lead Market Momentum
$11
10 Oct 2025, 13:13
Neutral
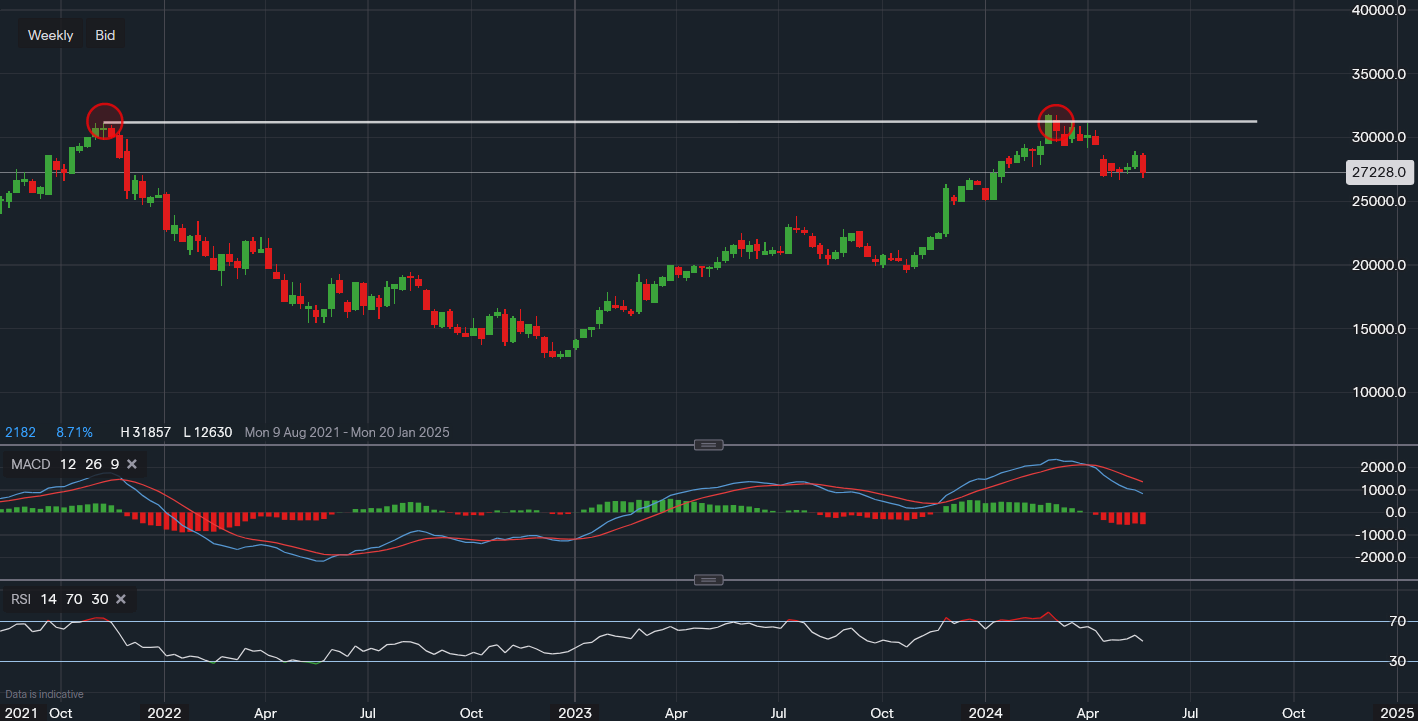
Chart & Data from IG
Taking a look at Salesforce as it reports earnings later in the week. Currently, its stock is trading at around $272.28 a share. Based on the weekly chart, we can clearly see that a rejection at the all-time high resistance of $311.64 was too resilient. Leading to the recent sell-off to the current levels. The near-term support has been formed at $266.50 after a gap down a few weeks prior to this support being formed. The price came close to testing this support last week but only fell as low as $268.47. With the earnings looking, it is difficult to determine whether this level will be tested before the release. A break below this level would suggest that more downside could be underway and the point of focus would then shift towards the area of $246-$249, as this would become the next line of support. The bias has shifted a little to ‘bearish’ for the near term, hence, it would be unjustifiable to point out any resistance levels. However, if there are signs of consolidation ahead of the earnings, then climbing back above $289.63 would be a good starting point for Salesforce for any further possible upside from there and out. Heading over to the technical indicators, they are swaying towards that bearish bias. The MACD is negative and falling, whereas the RSI is also falling but still remains within that neutral range as it reads 49.

Tradable assets:
Min.Deposit:
Max Leverage:
FCA:

Rating:


