Test- FTSE 100 Kicks Off August on a High as BP and Senior Lead Market Momentum
$11
10 Oct 2025, 13:13
Neutral
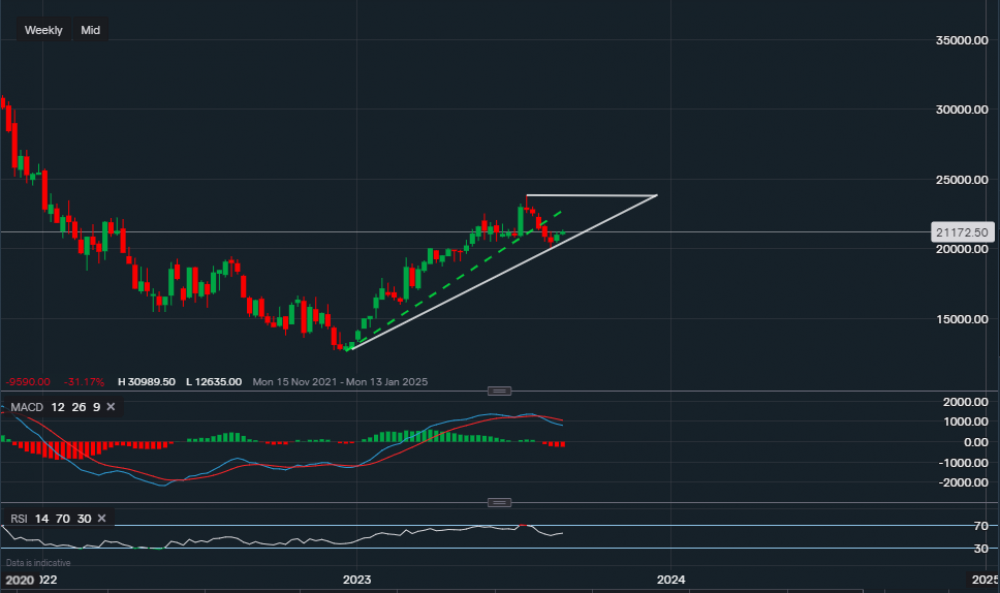
Chart & Data from IG
As the earnings season is coming to an end, we’re taking a look at Salesforce as it is due to report earnings tomorrow. Currently, its stock is trading at around $211.72 a share. If we look at the weekly interval, we can see some profit taking has been taking place since the week commencing 17th of July. The bears have now broken that initial support level (green trendline) dating back to January, and it can be argued that the price has now approached the next supportive trendline. Support along the white trendline reads $203.70, a break below it could see the price retrace lower towards $190.77. On the other hand, if there is some consolidation before tomorrow’s earnings report and if it is positive, then in September we may see a move back up towards the resistance of $238.19 (2023 current high). Looking at the technical indicators, they are suggesting a mixed approach the MACD remains negative but the RSI is positive as it reads 55.

Tradable assets:
Min.Deposit:
Max Leverage:
FCA:

Rating:


