Test- FTSE 100 Kicks Off August on a High as BP and Senior Lead Market Momentum
$11
10 Oct 2025, 13:13
Neutral
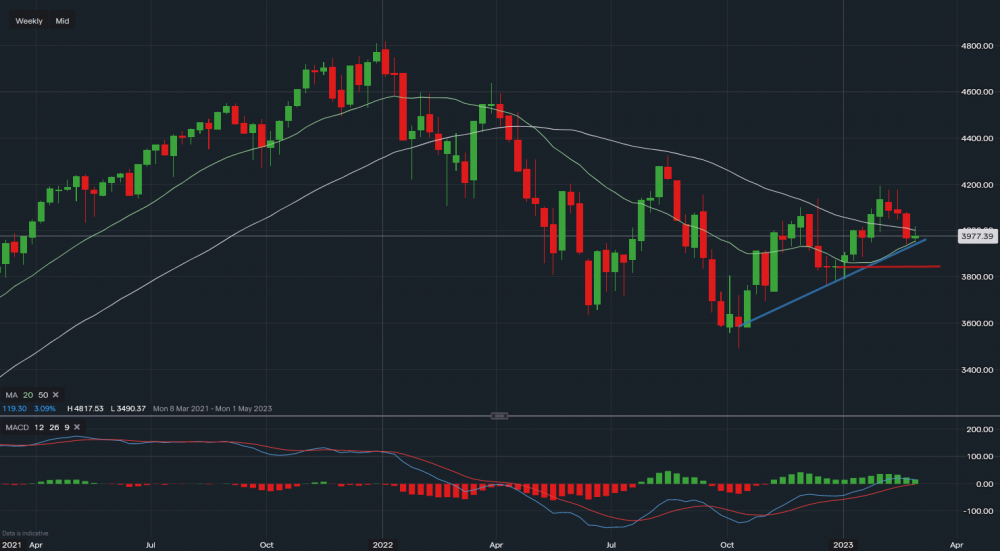
S&P 500 - Chart & Data from IG
February saw the S&P lose about 4% in value as markets continued to feel the pressure with inflation woes and interest rate hike fears. Looking at the chart, despite the drop in February, the S&P Continues to hold support dating back to October 2022. Major support for the index now sits between 3,920 and 3,950. A break below this level could see the index fall back to the December consolidation at 3,850. MACD is positive, however, is trending lower, suggesting the rally is yet to catch a bid towards the upside. Higher than-anticipated inflationary numbers from Europe and the USA will likely keep a lid on prices for March. Towards the upside, 4,128 acts as resistance followed by 4,200. For the moment, prices remain rangebound with good support below but tough resistance above - thus providing good potential swing opportunities in both the upside and downside direction.

Tradable assets:
Min.Deposit:
Max Leverage:
FCA:

Rating:


