Test- FTSE 100 Kicks Off August on a High as BP and Senior Lead Market Momentum
$11
10 Oct 2025, 13:13
Neutral
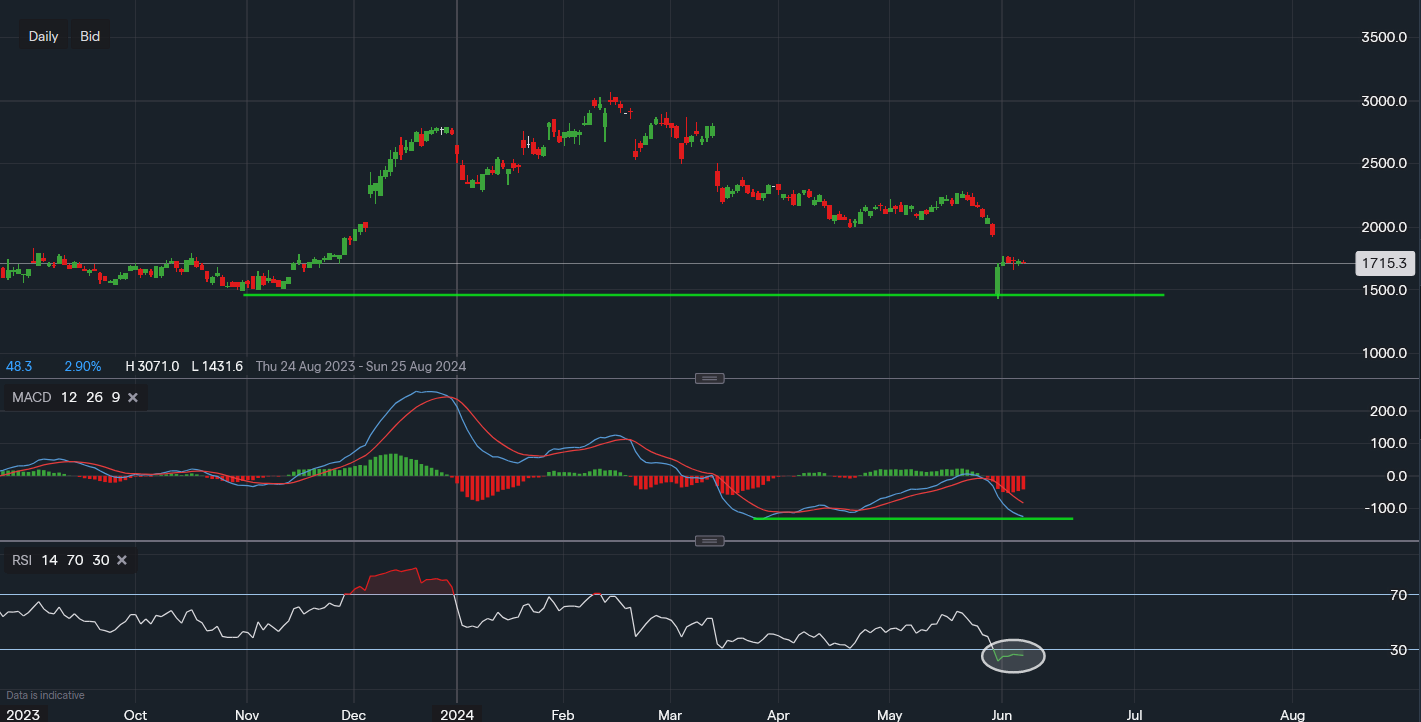
Chart & Data from IG
Taking a look at SentinelOne after the price gapped down going into Friday the 31st of May from the Thursday session. The stock closed last week at around $17.15 a share following an inflow of buyers after the gap down. We can see on the daily chart the stock is now trying to find some stability with near-term support at $16.58. A break below this level could see a sell-off towards the October lows of last year. However, looking at the technical indicators, the RSI suggests the stock is now oversold. With a reading of 25, not seen this low since June of 2023, we could see a short-term grind higher. The MACD demonstrates that the price has made a lower low but so far the indicator hasn’t, if the MACD can stabilise along the drawn trendline, a shift in momentum may occur. Near-term resistance reads $17.68, a break and close above could see the bulls push to fill the new gap around $19.30.

Tradable assets:
Min.Deposit:
Max Leverage:
FCA:

Rating:


