Test- FTSE 100 Kicks Off August on a High as BP and Senior Lead Market Momentum
$11
10 Oct 2025, 13:13
Neutral
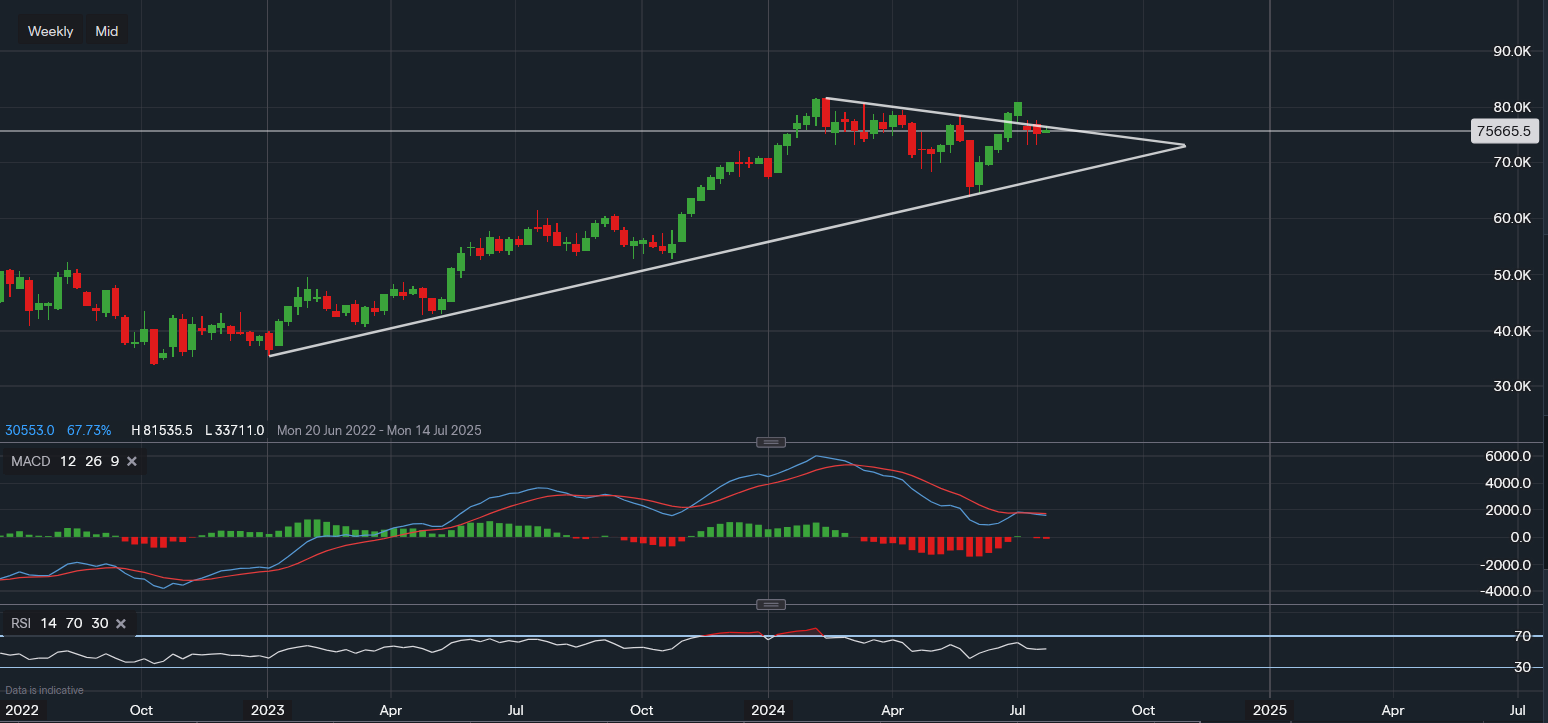
Chart & Data from IG
Taking a look at ServiceNow ahead of its earnings as the chart is looking is raising some concerns from a technical standpoint. We can see the price broke out towards the upside on the first week of July but then gapped down the following week. A signal of selling pressure and perhaps resistance around $806-$815. The share price of NOW has fallen back into the wedge pattern ahead of the earnings, which could be an early indication of increased selling from investors as part of profit-taking. The stock closed yesterday at $756.65 a share with the attention on the trendline resistance once again. The trendline resistance for this week reads $763.35, we can see there already have been two attempts to move higher but both have been rejected. Adding to the cautious approach. However, following the earnings, a move above the trendline resistance could see the closure of the gap above. This may then re-spark the bullish momentum for the near-term resulting in a pushback up to $800 a share. The support sits around $730-$731, which was tested last week. A break below this support level would certainly increase the possibility of a pullback towards the trendline support around the price level of $680. One factor that contributes to the concern for the near term is the positioning of the technical indicators, in particular the MACD. The MACD attempted to move above its signal line but failed, it is now below it once again. Suggesting the possibility of a rotation in momentum, favouring the sellers. The RSI has also now entered a neutral stance from the positive one only three weeks ago.

Tradable assets:
Min.Deposit:
Max Leverage:
FCA:

Rating:


