Test- FTSE 100 Kicks Off August on a High as BP and Senior Lead Market Momentum
$11
10 Oct 2025, 13:13
Neutral
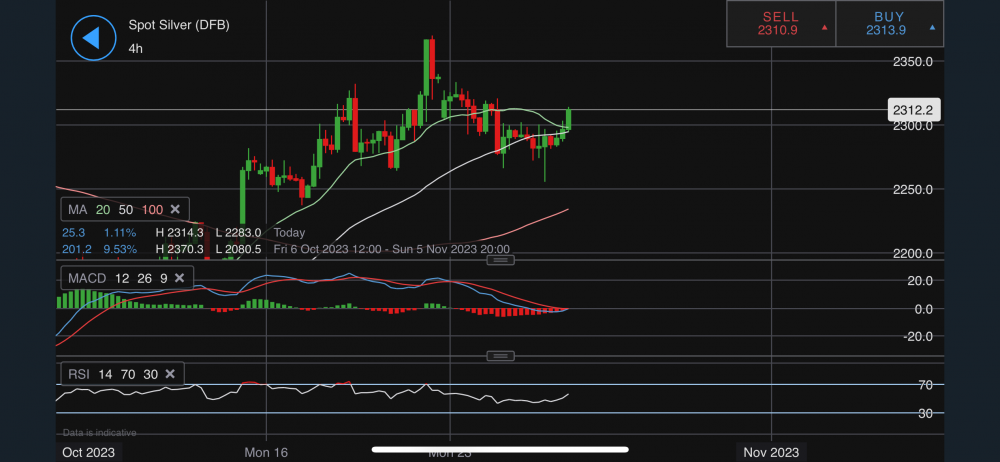
Chart & Data From IG
Silver currently trading at around $23.12 an ounce. From a technical aspect, we can see that the commodity has broken above the 20-day moving average after testing the 50MA. Looking at the 1-hourly chart we can also that an englufling candlestick has closed above the 100-MA, which is a bullish indication. Hence, next resistance sits at $23.34. A break above it could see an extension towards $23.50. Though this is not guaranteed, yesterday's sell off over in the US led to overnight losses in Asia and has been followed through into the European open. This risk-off sentiment boosts commodities, so called 'safe havens', as investors move their cash into such markets in times of high market volatility. Key support on the 4-hourly timeframe sits $22.52 and a break below it may see a move lower towards the support along the 100-day MA ($22.40). Looking at the technical indicators, the MACD seems like it is turning positive and the RSI has already turned positive.

Tradable assets:
Min.Deposit:
Max Leverage:
FCA:

Rating:


