Test- FTSE 100 Kicks Off August on a High as BP and Senior Lead Market Momentum
$11
10 Oct 2025, 13:13
Neutral
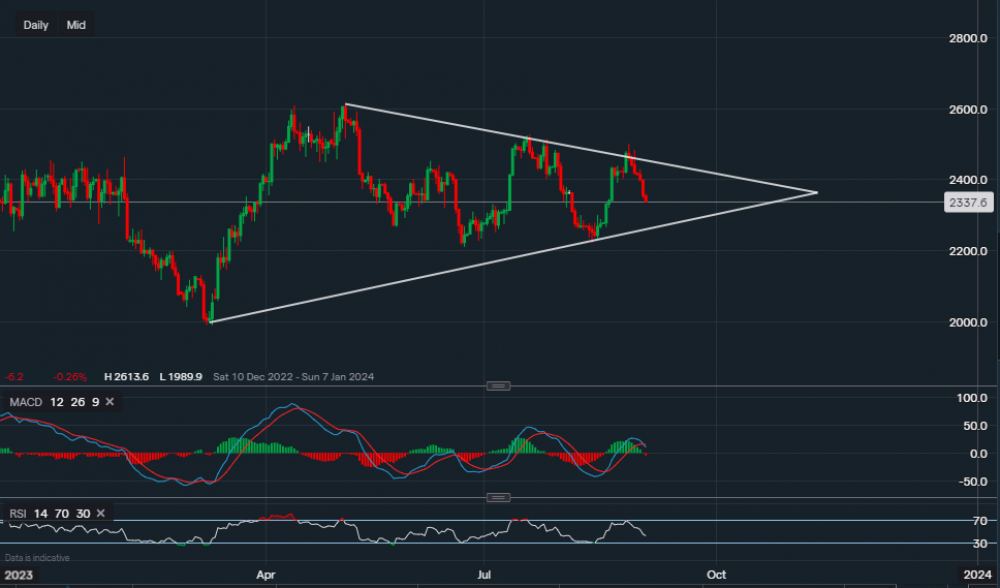
Chart & Data from IG
Taking a look at Silver as it has tested the resistance of $24.62 but failed to overcome it. Since the rejection last Wednesday, the price has been in a bearish trend. Currently, the commodity is trading at around $23.37 an ounce. Now looking at the support levels below, minor support sits at $23.21 then at $22.92 and then at $22.70 (along the ascending trendline). A break below the trendline would not necessarily mean that this bearish trend will continue, as there still is a key support level of $22.22. Plus, as we have seen before, the last time the price touched the trendline we had a rally higher. It would be unreliable to look at any upside resistance at this moment in time. Consolidation around current levels or a pullback towards the trendline would offer a better risk to reward. Looking at the technical indicators, MACD has now turned negative on the daily and so has the RSI as it now reads 42.

Tradable assets:
Min.Deposit:
Max Leverage:
FCA:

Rating:


