Test- FTSE 100 Kicks Off August on a High as BP and Senior Lead Market Momentum
$11
10 Oct 2025, 13:13
Neutral
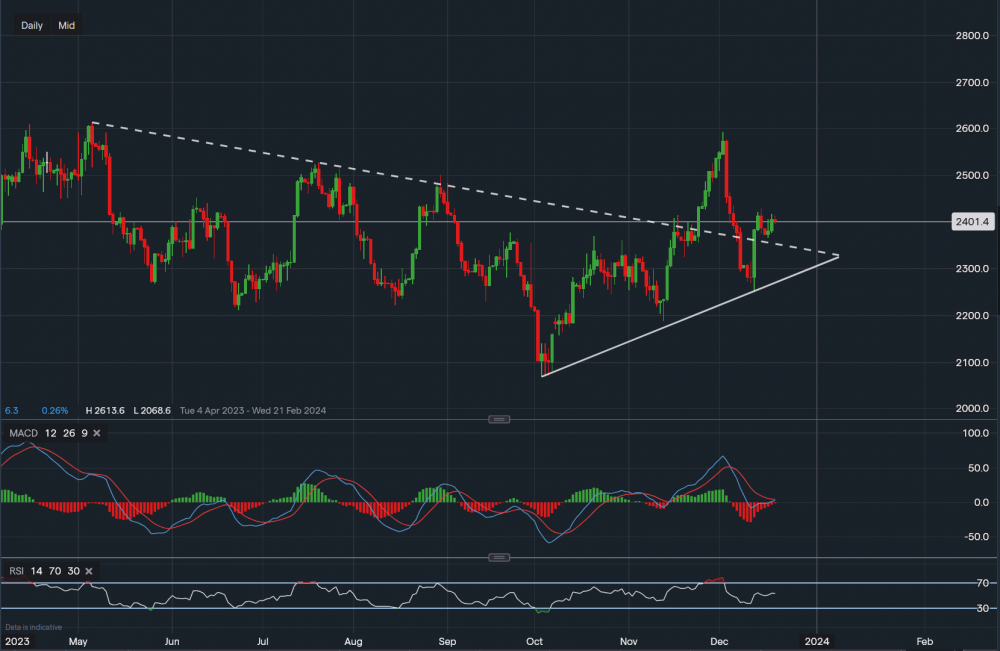
Chart & Data from IG
Silver has clearly broken out of the descending trend during the November month heading into December, closing at a price of $25.73 an ounce on the 3rd of December. This was above the resistance of $25.01 and $25.27. Since then, the price of Silver fell and what seemed like a retracement with the expectation of testing the supportive trendline, which was the previous resistance (dotted trendline), trapped traders as the fall was bigger than anticipated. The commodity actually created a new support level of $22.51, which corresponds with the rising trendline drawn on the chart. However, the price now climbed above the trendline resistance causing a resistance-support flip once again. The support reads $23.52. A break back into the triangle could be perceived as a bearish indication, suggesting the momentum is fading due to a lack of buying demand. If a move back into the triangle was to occur then the focus would turn to the support of $22.96 (along the ascending trendline). Currently, Silver is trading at around $24.01 an ounce. The resistance now is present at $24.17 followed by $24.29. A break and close above $24.29 could be an indication that the breakout was successful and a rally back up to $25-$26 is underway. Looking at the technical indicators, the MACD is only just negative but volumed has lowered significantly, could be argued that it is almost flat. The RSI is neutral as it reads 52. Hence, a pretty neutral outlook at this moment in time.

Tradable assets:
Min.Deposit:
Max Leverage:
FCA:

Rating:


