Test- FTSE 100 Kicks Off August on a High as BP and Senior Lead Market Momentum
$11
10 Oct 2025, 13:13
Neutral
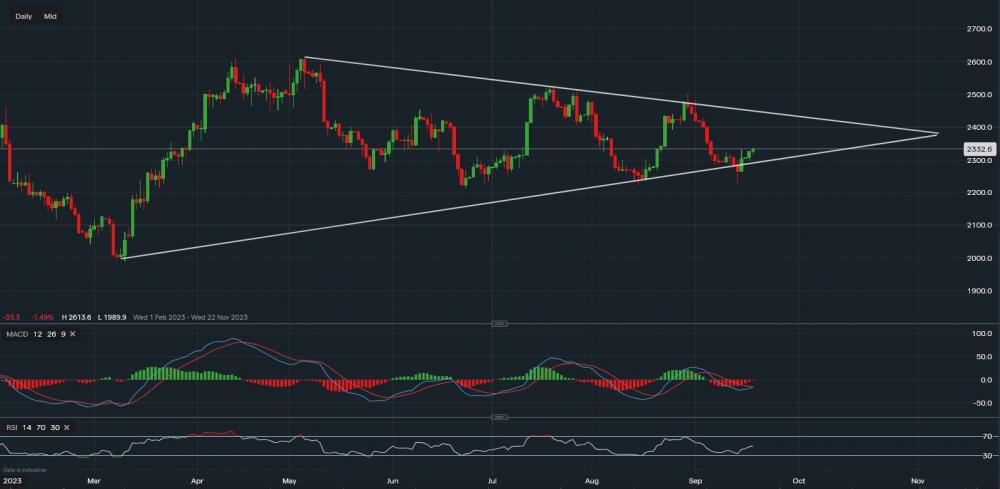
Chart & Data from IG
Taking a look at Silver as it continues to sit within the symmetrical triangle drawn on the chart, currently trading at around $23.32 an ounce. We can see that a false breakout occurred on the 14th of September, drawing in sellers before a bounce back into the triangle the following day. The price has now created a new support level of $22.29, which corresponds with the support base now between $22.11-$22.29. The commodity is now back on the rise, potentially targeting the upper trendline of the triangle once again. However, the FOMC outcome is due tomorrow which will certainly have an impact on Silver. At this moment in time, resistance sits at $23.37 then at $23.70, and then at $23.92. Another move out of the triangle towards the downside would be an indication that selling pressure is overpowering, only then, would more downside be likely. Looking at the technical indicators, MACD is negative but on the verge of turning positive and the RSI is now neutral as it reads 50.

Tradable assets:
Min.Deposit:
Max Leverage:
FCA:

Rating:


