Test- FTSE 100 Kicks Off August on a High as BP and Senior Lead Market Momentum
$11
10 Oct 2025, 13:13
Neutral
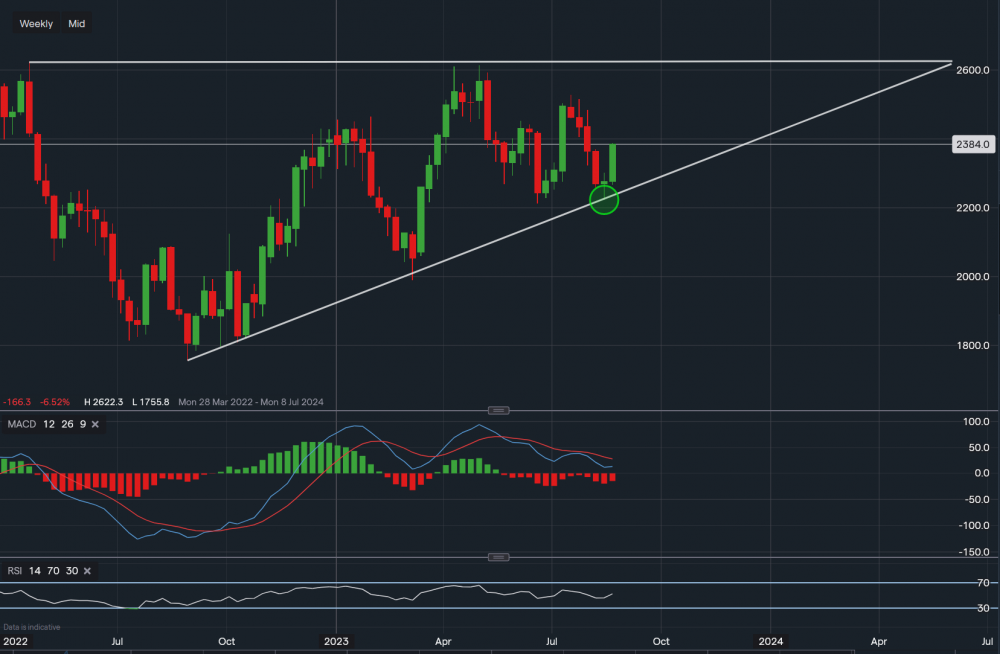
Chart & Data from IG
Taking a look at Silver on a weekly timeframe for potential support and resistance zones in the short-medium term, currently, it’s trading at around $23.83 an ounce. We can see the last week it has found support along the ascending trendline of the triangle, which can be found at $22.22 (oval). A break below this level would indicate that bears are in control and further downside would be likely, with the possibility of reaching $20 an ounce (approximately). Though silver has had a strong start to the week, currently up 1.8% on the day. Looking at the upside, resistance levels now sit at $24.02 then at $24.52 and then at $25.27. A break above $25.27 could lead to an attempt on the tough resistance resting at $26.22 (upper trendline). Looking at the technical indicators, MACD is negative but RSI has now turned neutral as it reads 52. The upcoming Fed speeches from the likes of Jerome Powell and next month’s monetary policy decision will play a key part in the future of this commodity’s price in the near future.

Tradable assets:
Min.Deposit:
Max Leverage:
FCA:

Rating:


