Test- FTSE 100 Kicks Off August on a High as BP and Senior Lead Market Momentum
$11
10 Oct 2025, 13:13
Neutral
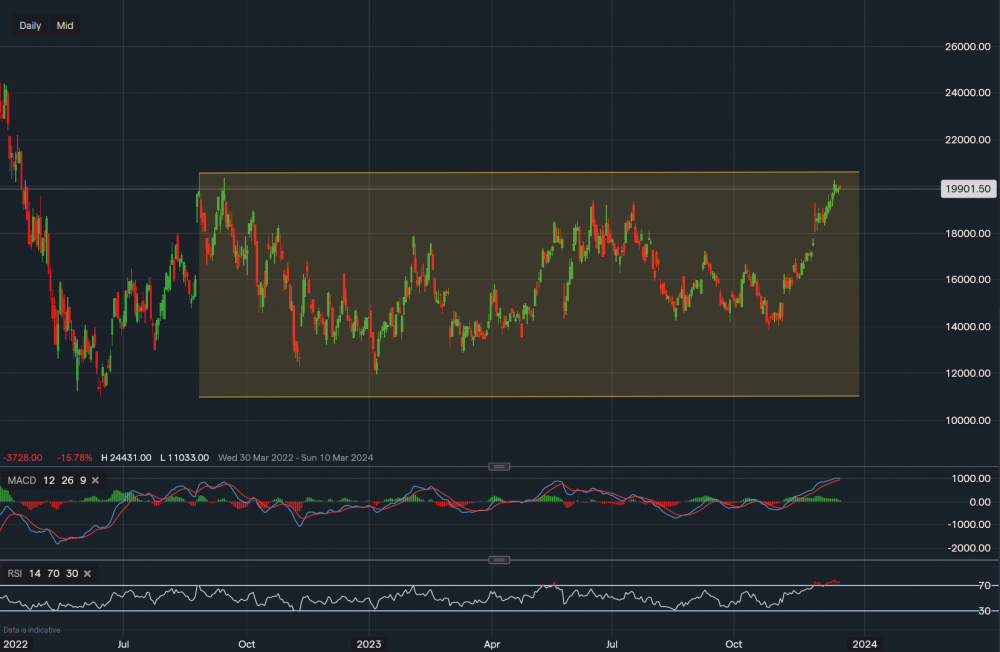
Chart & Data from IG
Snowflake’s shares remain pretty rangebound within the channel drawn on the chart. Currently, its share price sits around $199.01 a share. We can see that the price has now approached the upper half of the channel, with the resistance at reach. On the 14th of December, a high of $202.76 was recorded, but the momentum has now stagnated a little. The key resistance here for investors is $205.60, which corresponds with the upper trendline of the channel. A break and close above this resistance would be a bullish indication, and perhaps a new rally would be underway with an average of around $220. But of course, this would not be guaranteed as fall breakouts can occur (bull trap). Support here for investors starts with yesterday’s low of $196.56, which is the minor level. A break below it would then shift the focus to $183.07. Only a move below $183.07 would raise some concern of potentially further declines towards the bottom half of the channel. Looking at the technical indicators, they are both positive with the RSI reading 75. However, they are also suggesting caution so awareness is required at this moment in time. The MACD line is starting to curve and the volume has now lowered significantly. Regarding the RSI, it is technically in overbought territory so a short-term move lower could occur. It is important to note that even though these are lagging indicators and therefore not always accurate, they should not be ignored.

Tradable assets:
Min.Deposit:
Max Leverage:
FCA:

Rating:


