Test- FTSE 100 Kicks Off August on a High as BP and Senior Lead Market Momentum
$11
10 Oct 2025, 13:13

Chart & Data from IG

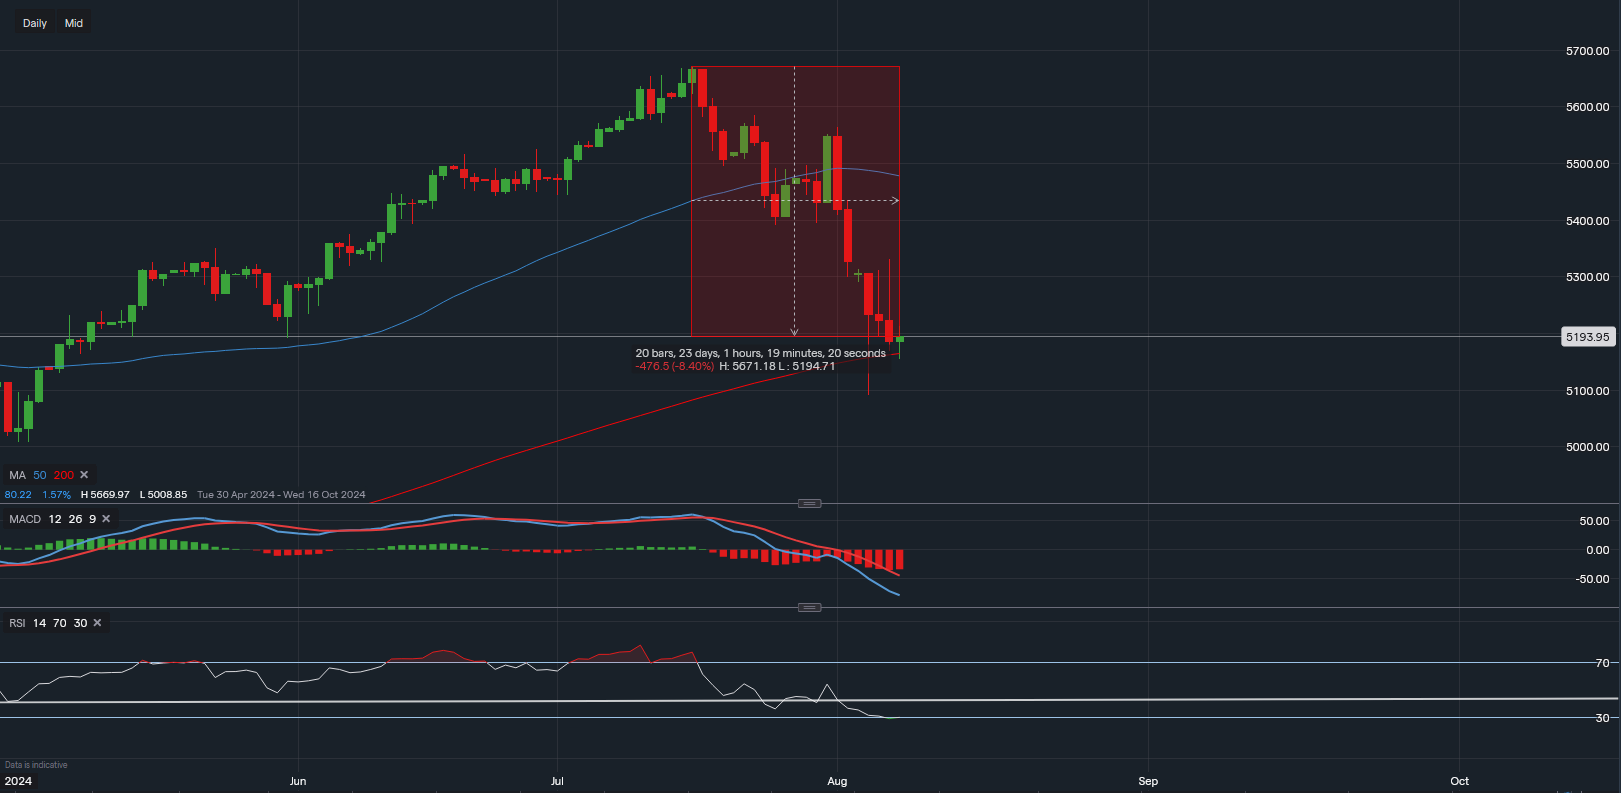
The SP500 is now down 8.4% peak to trough from the pullback that began on the 17th of July. Currently, the index is trading at around 5,193 and we have spotted some key factors to keep an eye on for the coming days. First of all, the price of the index is now sitting along its 200-day moving average, which so far is offering support. Not always, but markets can experience a small bounce/rally from in and around the 200MA before more market data is present. This tends to be due to the inflow of buyers and traders for short-term gains. Another factor that may contribute to a small bounce from here is the positioning of the technical indicators. Both the MACD and the RSI are suggesting that the market is now somewhat oversold. The MACD is at its lowest level since October of 2022 and the RSI has entered oversold territory as it reads 29. The last time the RSI reading was 29 was at the bottom of the pullback in April. The 200MA is currently reading 5,164, a break and close below it would indicate that more downside may be underway. However, there is also support from Monday’s global market sell-off which reads 5,090. Hence, a dip below here would be required for potentially further declines. Towards the upside, the risk is greater and more limited right now. But a bounce off the 200MA could test the levels of 5,239 then 5,256 and maybe even 5,276. However, caution should remain.