Test- FTSE 100 Kicks Off August on a High as BP and Senior Lead Market Momentum
$11
10 Oct 2025, 13:13
Neutral
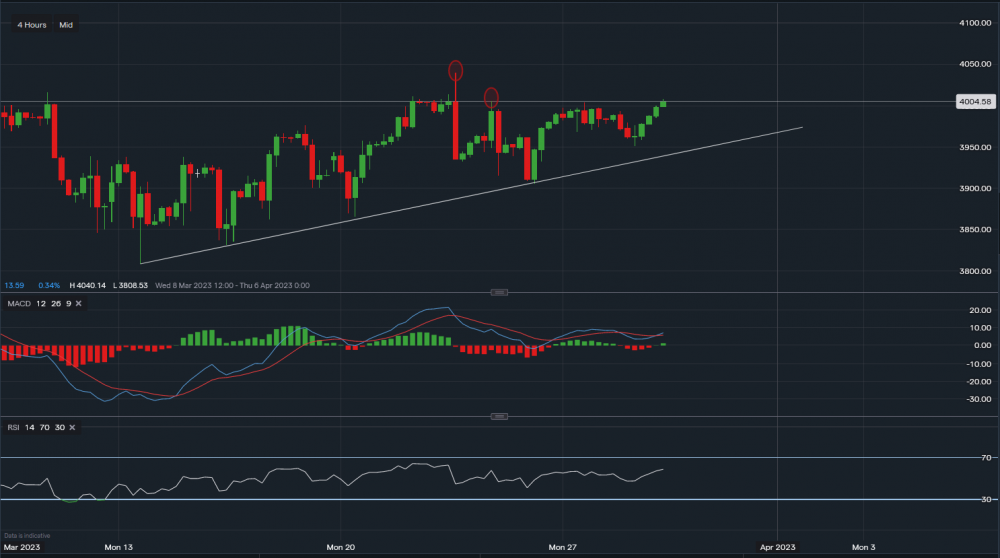
Chart & Data from IG
From a technical aspect, the SP500 is trading at around 4004. We can see that on the 4 hourly timeframes that the index is approaching the resistance levels sitting at 4005 followed by 4040. These are highlighted by the two red ovals on the chart. A break above 4040 could see the index head towards the 4060-4070 range. Support is currently well established below along the trendline, with the first support level sitting at 3951 (corresponds with the trendline). A break below this support level may see the index decline further testing the support level at 3905. Taking a look at the technical indicators, the RSI is positive as it reads 59 and the MACD has just turned positive.

Tradable assets:
Min.Deposit:
Max Leverage:
FCA:

Rating:


