Test- FTSE 100 Kicks Off August on a High as BP and Senior Lead Market Momentum
$11
10 Oct 2025, 13:13
Neutral
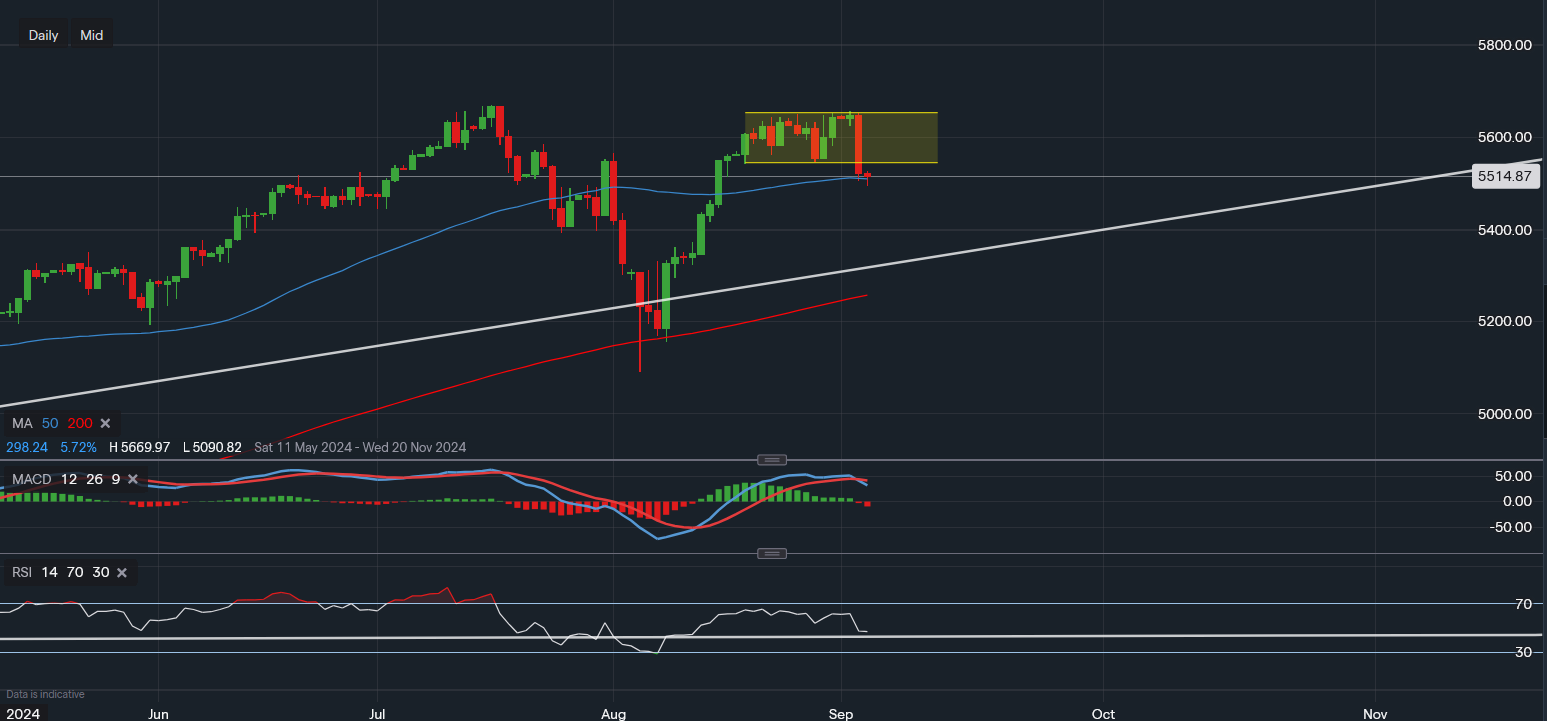
Chart & Data from IG
Taking a look at the SP500 as the index broke below the previous range, moving below the support of 5,544 in yesterday’s session. The index is now trading at around 5,514 in the pre-market trade, with support at the 50-day moving average holding up for now. The 50MA is reading 5,509, and the SP500 slid lower recording a low of 5,494 but has now creeped back above. A clear break below this support level would suggest that further weakness and worries about the US economy persist, with the next support level around 5,400 followed by trendline support around 5,350. As the sentiment has already somewhat soured due to the historically known poor performance in September, the bias has swayed in favour of the bears. Bulls would need to see a move back above 5,550 to re-enter the previous range zone. However, the upside will be capped until a clear break above 5,655 occurs. Looking at the technical indicators, the MACD is turning negative once and again and the RSI is almost with the bearish territory as it reads 46.

Tradable assets:
Min.Deposit:
Max Leverage:
FCA:

Rating:


