Test- FTSE 100 Kicks Off August on a High as BP and Senior Lead Market Momentum
$11
10 Oct 2025, 13:13
Neutral
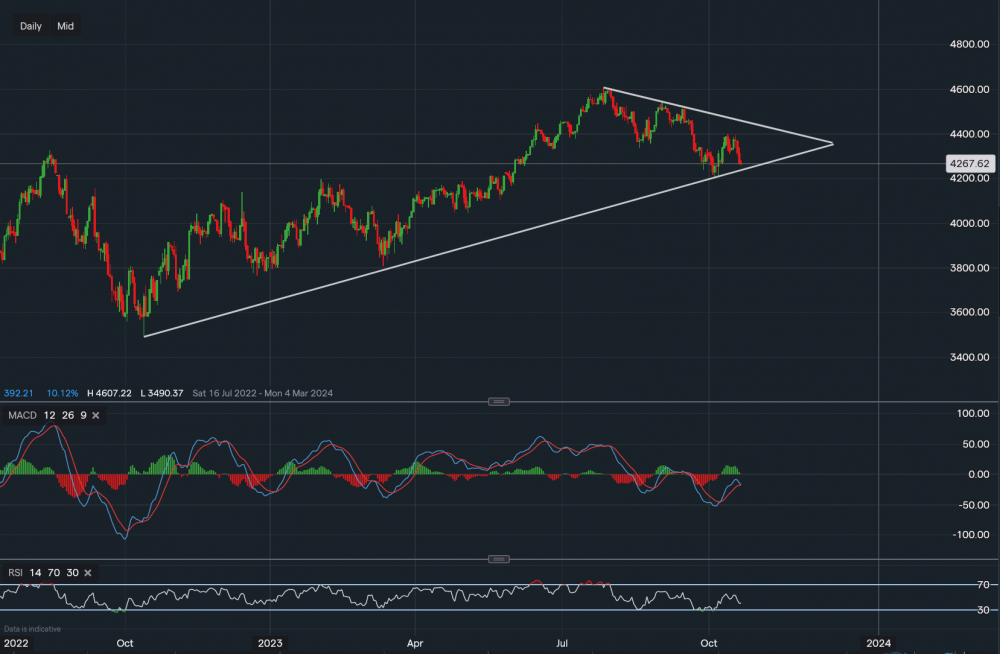
Chart & Data from IG
The SP500 is approaching the key support along the ascending trendline once again after Jerome Powell’s speech yesterday. Powell said that additional rate hikes may be needed if resilience persists and signs of cooling down aren’t more prominent. Currently, the index is trading at around 4,267. The support sits at 4,237 (along the trendline), a break below it would first need to test the support of 4,200 before any moves even lower. A break below 4,200 could see an extension towards 4,171. Consolidation along the trendline may attract bulls and perhaps see a small bounce back, however, this is not guaranteed and the size of the bounce is difficult to calculate at this moment in time. Nevertheless, if there is consolidation followed by a bounce, then a break above 4,342 could once again see a move towards 4,400. If we look over to the technical indicators, they pretty much point towards the downside, The MACD line is practically touching the signal line but hasn’t turned negative as of yet, and the RSI is slightly negative as it reads 41.


Tradable assets:
Min.Deposit:
Max Leverage:
FCA:

Rating:


