Test- FTSE 100 Kicks Off August on a High as BP and Senior Lead Market Momentum
$11
10 Oct 2025, 13:13
Neutral
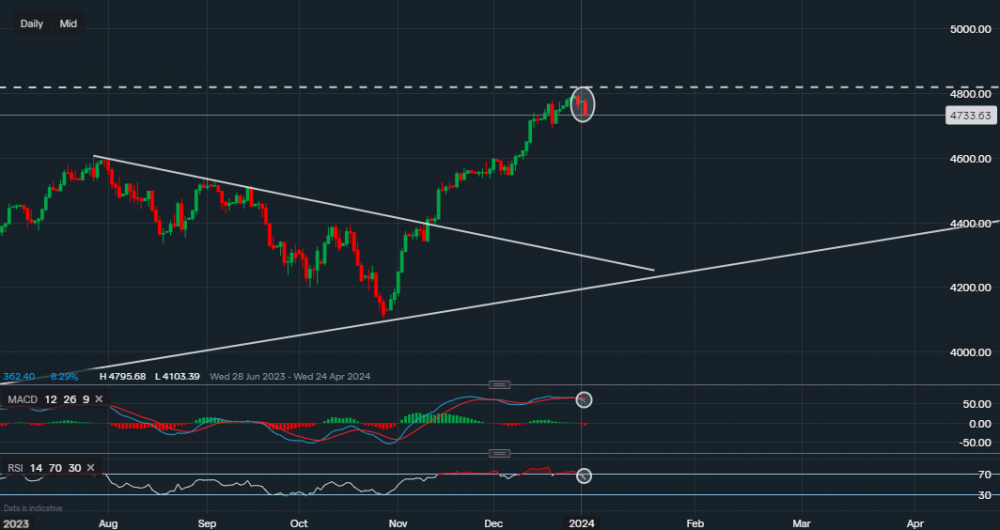
Chart & Data from IG
Taking a look at the S&P 500 as the index is now pointing to some possible downside in the short-term. Currently, it is trading at around 4,733. On Friday the 29th of December we can see that the index closed lower than it opened on Thursday, which in theory is a negative sign. The next key support here for investors and traders to look out for is 4,691, a break below this level would be a slight indication that further downside is likely. In that case, the focus would then turn to 4,643 and then 4,607. However, with 4,691 being the key level here, we may see buyers rush in causing some consolidation due to increased volatility. It would be unreasonable to point out any resistance levels as the short-term bias seems mixed. This bias is backed by the technical indicators as we can see they are beginning to falter. The MACD has now turned negative with the MACD line crossing its signal line and the RSI has now fallen from the ‘overbought’ territory. Although, it is still positive as it reads 60.

Tradable assets:
Min.Deposit:
Max Leverage:
FCA:

Rating:


