Test- FTSE 100 Kicks Off August on a High as BP and Senior Lead Market Momentum
$11
10 Oct 2025, 13:13
Neutral
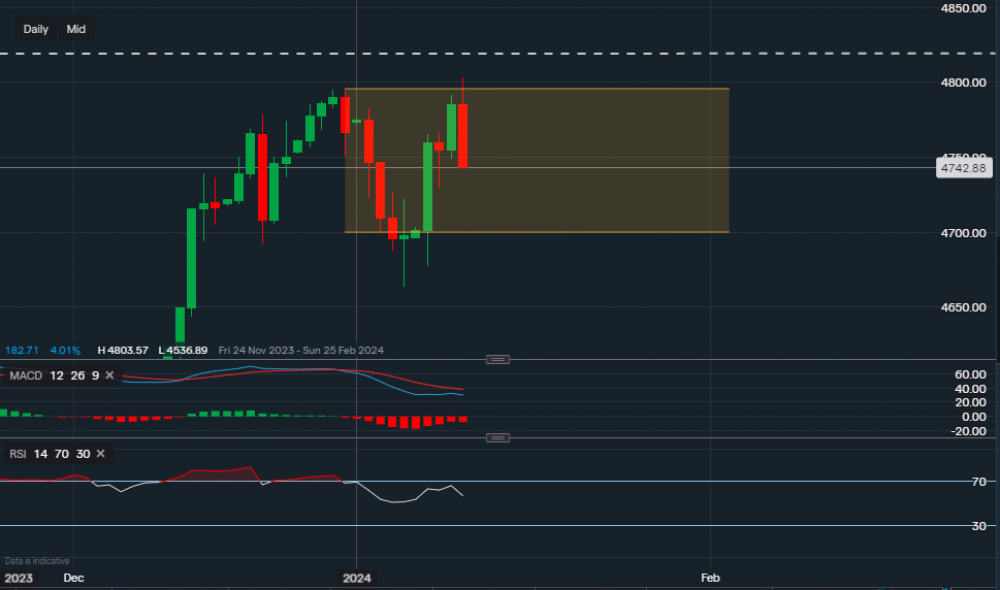
Chart & Data from IG
The SP500 is now trading at 4,752 after reaching a high of 4,803 earlier. The inflation data came in worse than expected, therefore, putting more pressure on the Federal Reserve as to whether it is too early to cut rates in March. We can see that the index tried to push higher but was rejected, this tends to be a bearish signal and now we may see the index move lower to re-test the support. The support levels now sit at 4,729 and then roughly at 4,000, which is acting as the base support of the channel drawn on the chart. Since the start of January, the SP500 has been rangebound between 4,700-4,800. Another test of the support of 4,700 followed by a break below could be the moment the bears are waiting for, this would indicate that a move lower is possible. Selling pressure has certainly increased, along side this, if today’s session closes below yesterday’s low then it increases the likelihood of a bearish continuation tomorrow. It also could be argued that this week’s rally has created a slightly smaller high, another bearish indicator. Nevertheless, bears are still in control for the time being and if 4,700 is upheld then another attempt to push higher cannot be ruled out. Looking at the technical indicators, the MACD is slightly negative and the RSI is now slowly sliding as it reads 57.

Tradable assets:
Min.Deposit:
Max Leverage:
FCA:

Rating:


