Test- FTSE 100 Kicks Off August on a High as BP and Senior Lead Market Momentum
$11
10 Oct 2025, 13:13
Neutral
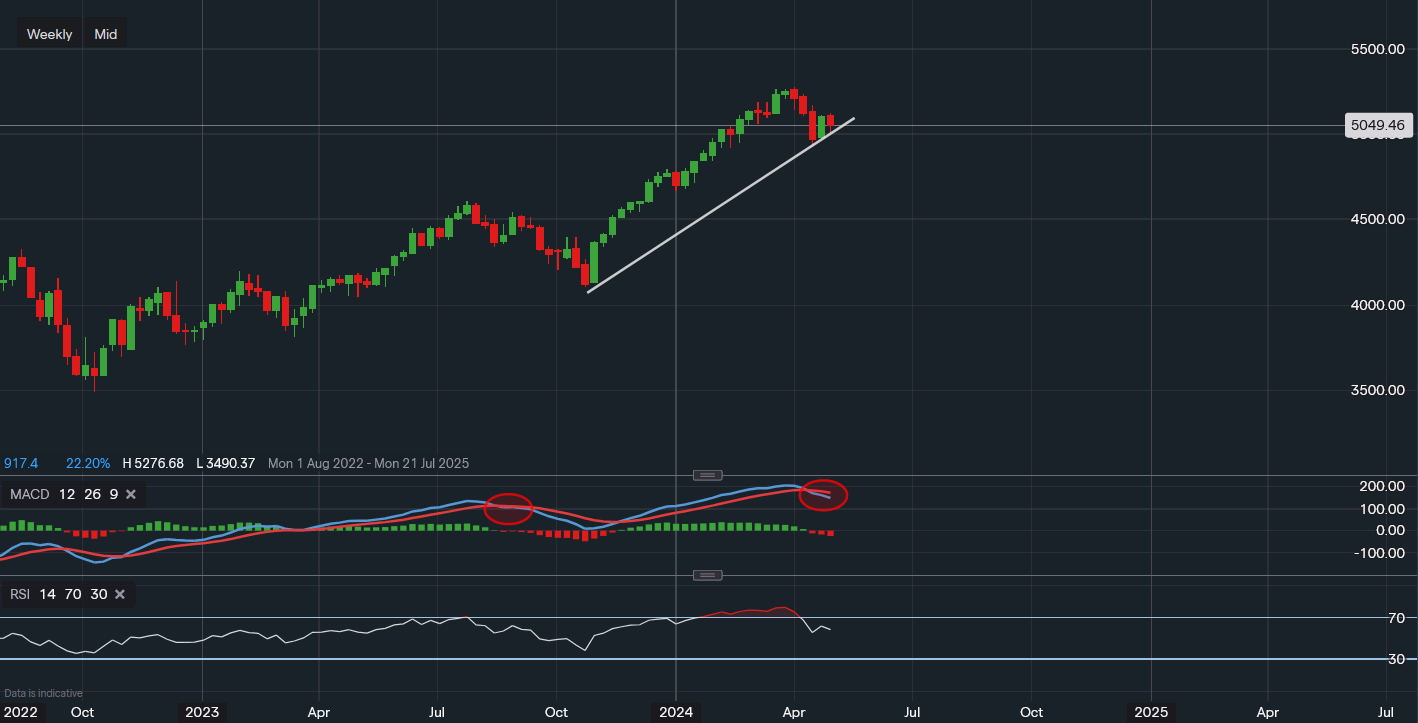
Chart & Data from IG
Taking a look at the SP500 after yesterday’s Fed decision to keep interest rates unchanged. Fed Chair Jerome Powell reiterated the point that more data showing inflation pressures are easing is required for consideration of lowering interest rates. Although, he also made the point that another interest rate hike is looking less likely, which saw the markets whipsaw. Currently, the index is trading at around 5,049. Looking at the chart based on a weekly interval, we can see that after three consecutive down weeks, the index found some support at the level of 4,926. This led to a bounce higher following strong earnings from Big Tech last week. Nonetheless, the current week is heading for another decline unless we see a turnaround across Thursday’s and Friday’s sessions. Nonfarm payrolls are due tomorrow and may act as a catalyst here for the near-term direction. Support now sits higher up the trendline, reading around 5,000 on the dot. A break below the trendline could spur a further sell-off for a re-test of 4,926. The resistance in focus is this week’s high of 5,123. A move above this level would perhaps create some confusion as it would imply that the investor bias is shifting towards bullish once again. Or perhaps it could be a ‘bear trap’. An important factor to keep an eye on here is the MACD technical indicator. Even though it is a lagging indicator it does provide an insight on the market sentiment and bias for the longer-term. Looking at the pullback that occurred between August and October of last year, when the MACD crossed below its signal line, the SP500 experienced at 10% correction from peak to trough. If we look at the current MACD we can see that it has crossed below its signal line once again. Now, this does not necessarily imply that the SP500 will experience yet another 10% decline, but it does highlight that selling pressure is increasing and that potentially more downside is possible (near-term). The RSI has now also faltered somewhat as it reads 58.

Tradable assets:
Min.Deposit:
Max Leverage:
FCA:

Rating:


