Test- FTSE 100 Kicks Off August on a High as BP and Senior Lead Market Momentum
$11
10 Oct 2025, 13:13
Neutral
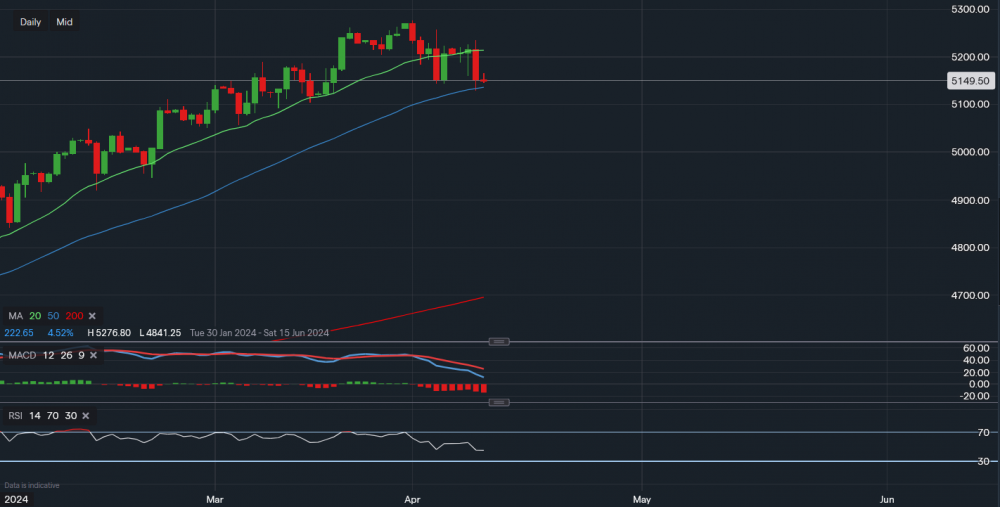
Chart & Data from IG
Taking a look at the SP500 after it continues to pull back from one of its notorious bull runs. Currently, the index is trading at around 5,149, down 2.36% from its peak. Based on the daily chart, we can see that it has now approached its 50-day moving average. The index tested the support of the 50MA in yesterday’s session but managed to close above it, however, we can see that the pre-market trading is forcing it towards it once again. A break and close below the 50MA would suggest that further weakness is likely, creating concerns for a more significant correction. Consequently, this would then shift the focus towards levels 5,091 and maybe 5,056. However, consolidation along the 50MA would certainly incentivise the bulls to buy this dip. Dip buying may lead to a small bounce back into the area of 5,160-5,190. Though it is important to note that both the MACD and RSI have turned negative, with the RSI reading 44.

Tradable assets:
Min.Deposit:
Max Leverage:
FCA:

Rating:


