Test- FTSE 100 Kicks Off August on a High as BP and Senior Lead Market Momentum
$11
10 Oct 2025, 13:13
Neutral
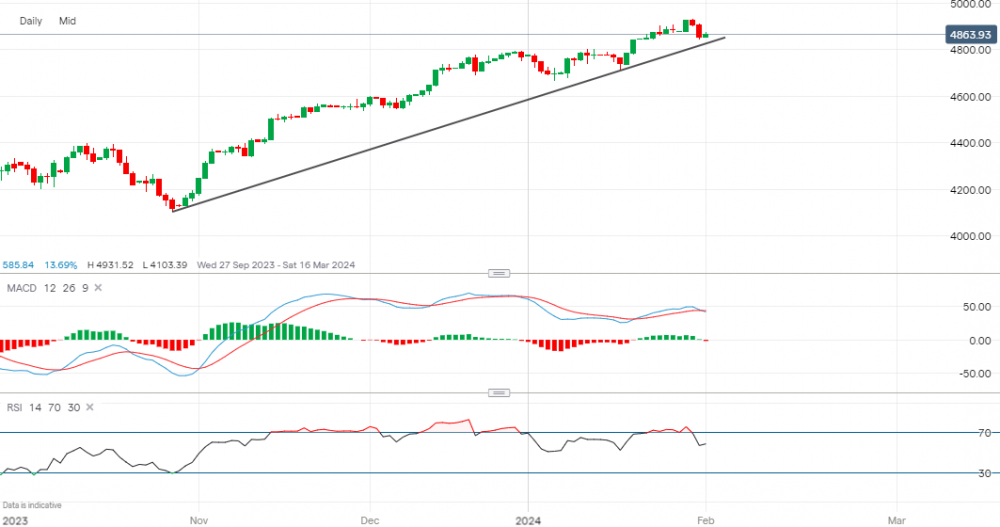
Chart & Data from IG
A big test here for the SP500 as the index is now approaching this key support trendline, which dates back to October. Currently, the index is trading at around 4,863, with the support along the trendline reading 4,829. A break and close below this support could then see a further sell-off towards the support of 4,712. However, there is also a psychological support level of 4,800 as this was the previous resistance. If the index manages to hold above 4,800 and possibly this trendline support then we certainly could see a resumption of the bullish trend back up to 4,900 and beyond. Key resistance for a move higher is now the all-time high of 4,931. The Federal Reserve maintained its interest rates yesterday as Jerome Powell kept a fairly hawkish tone, suggesting that a rate cut in March is unlikely based on recent inflation/economic data. Some analysts are now forecasting the first cut to come in May. Looking at the technical indicators, yesterday's outcome has created some concern and as a result, the indicators on the daily timeframe have started to falter. The MACD seems to be turning negative and the RSI has dropped of as it now reads 58.

Tradable assets:
Min.Deposit:
Max Leverage:
FCA:

Rating:


