Test- FTSE 100 Kicks Off August on a High as BP and Senior Lead Market Momentum
$11
10 Oct 2025, 13:13
Neutral
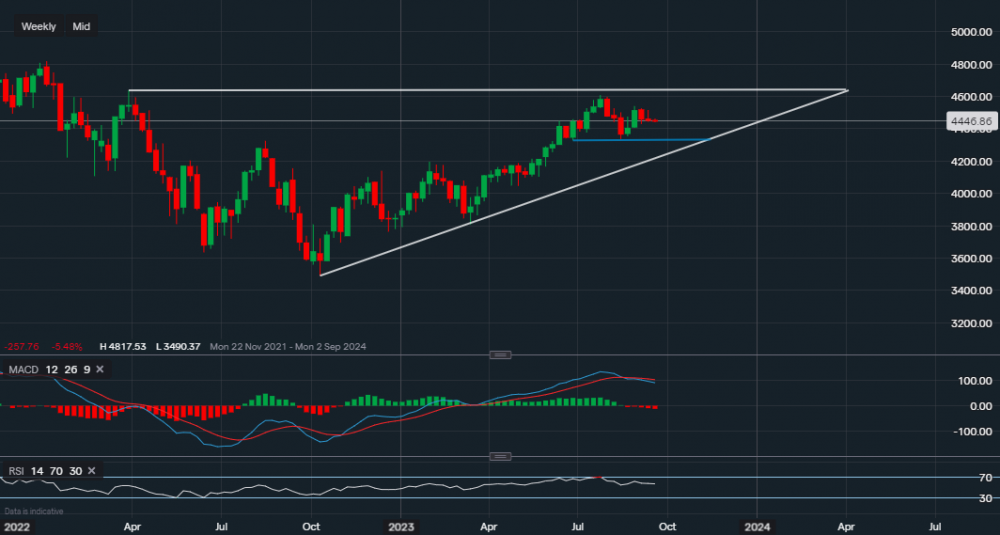
Chart & Data from IG
Taking a look at the SP500 on the weekly timeframe ahead of the FOMC on Wednesday. Currently, the index is trading at around 4,446. We can see that a new level of support at 4,336 was created on the week commencing the 21st of August, almost testing the support of 4,328 (blue trendline). A break below 4,446 and 4,328 would suggest that further downside is possible, we would then look towards support sitting at 4,166. Towards the upside, resistance now sits at 4,540. A move above it would create a potential opportunity for an attempt at 4,607, the resistance level set back in July. Markets and investors are anticipating that the Federal Reserve will pause its rate hikes for the time being, but may remain hawkish for longer (i.e. keeping rates the same for longer than hoped). Therefore, the future vision is unclear, as of yet, as there is uncertainty on how the markets will react to this news. The longer-term bias remains bullish for the SP500 but if you look deeper into the technicals, such as the MACD and the RSI, we can see that the MACD has turned negative and the RSI has faltered over recent weeks as it now reads 57. Though still positive. As the shorter-term outlook is mixed, we may see the index drift a little lower ahead of the FOMC and perhaps shift sideways.

Tradable assets:
Min.Deposit:
Max Leverage:
FCA:

Rating:


