Test- FTSE 100 Kicks Off August on a High as BP and Senior Lead Market Momentum
$11
10 Oct 2025, 13:13
Neutral
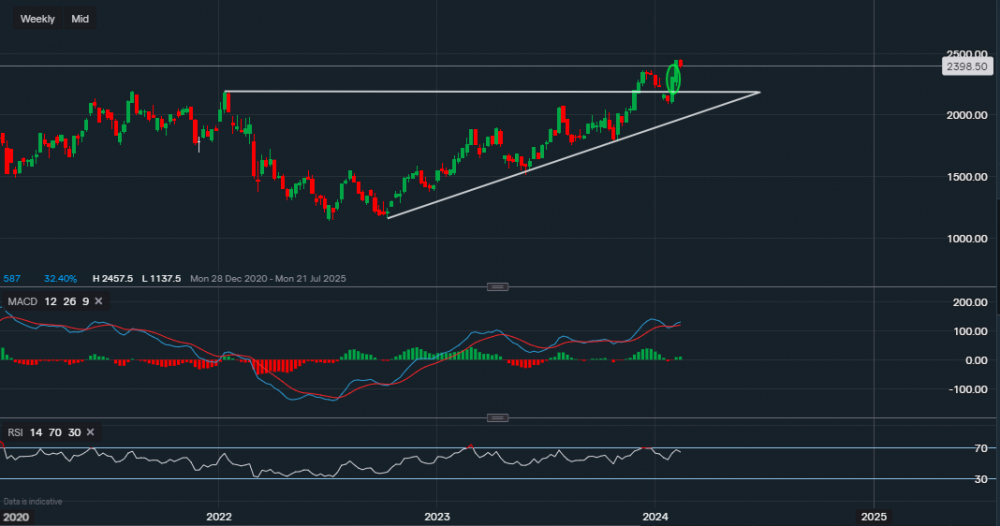
Chart & Data from IG
Stellantis seems to have broken out to the upside, breaking through the upper trendline resistance. It did pullback after the break for a re-test of the support, which was the previous resistance of $21.92, and it has now continued higher. The company is expected to report earnings tomorrow so it will be interesting to see whether this newly formed support can uphold its strength or whether the shares will dip back into this triangle area zone. As already mentioned, the support here is now $21.92. A break below it could then see a further slide towards ascending trendline support of $19.81. Regarding the potential upside, the shares are only 4.5% away from all-time highs. Hence, a boost from the earnings could lead to a test of the all-time highs ($24.95). A break and close above $24.95 would allow investors to then eye up the $30 mark. Looking at the technical indicators, the MACD has turned positive once again after the breakout and the RSI reads 65. However, the RSI has dipped a little, most likely due to the upcoming earnings call.

Tradable assets:
Min.Deposit:
Max Leverage:
FCA:

Rating:


