Test- FTSE 100 Kicks Off August on a High as BP and Senior Lead Market Momentum
$11
10 Oct 2025, 13:13
Neutral
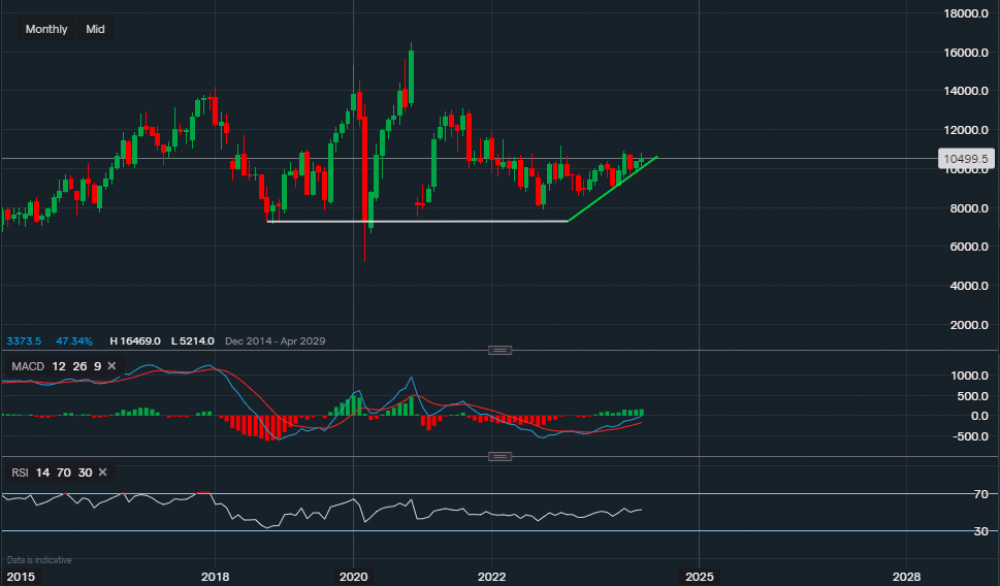
Chart & Data from IG
Taking a look at Synnex ahead of its earnings next week. Currently, its stock is trading at around $104.99 a share. Looking at the monthly chart, it seems like the stock may have found a base of support along the white trendline. With the key level reading $72.81. A break below this support could see a further decline towards $60 a share. However, this would require the stock to fall at least 31% first from current levels. We can see that the green trendline is providing support for the time being, with what seems like a grind higher so far this year. The key resistance here for investors is the level of $109.39, a break above could then see the price extend towards the area of $112-$119. The technical indicators are pointing to a positive bias, the MACD is positive and on the rise and so is the RSI as it reads 52.

Tradable assets:
Min.Deposit:
Max Leverage:
FCA:

Rating:


