Test- FTSE 100 Kicks Off August on a High as BP and Senior Lead Market Momentum
$11
10 Oct 2025, 13:13
Neutral
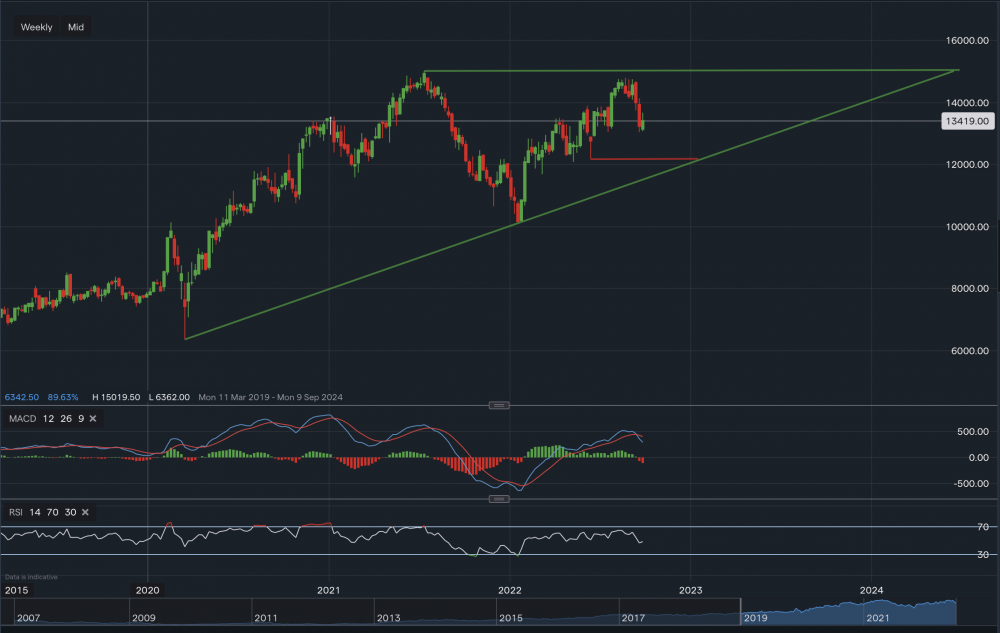
From a technical aspect, the shares of T-Mobile are in an uptrend with the ascending triangle acting as support and resistance. $129 is acting as the first support level followed by a support level at $121.74, which is where the red trendline corresponds with the bottom green trendline of the ascending triangle. A break below the bottom green trendline could see the share price of the stock slide towards the low $100’s. On the flip side, first line of resistance sits at $138.96 with a further resistance barrier at $148.04. A break above the $148.04 level, which is just below the upper green trendline of the triangle, could lead to short-term momentum. Due to this, the stock may also reach its all-time high market price, if a break above the ascending triangle occurs. MACD has turned negative but RSI reads 48, suggesting a neutral position.

Tradable assets:
Min.Deposit:
Max Leverage:
FCA:

Rating:


