Test- FTSE 100 Kicks Off August on a High as BP and Senior Lead Market Momentum
$11
10 Oct 2025, 13:13
Neutral
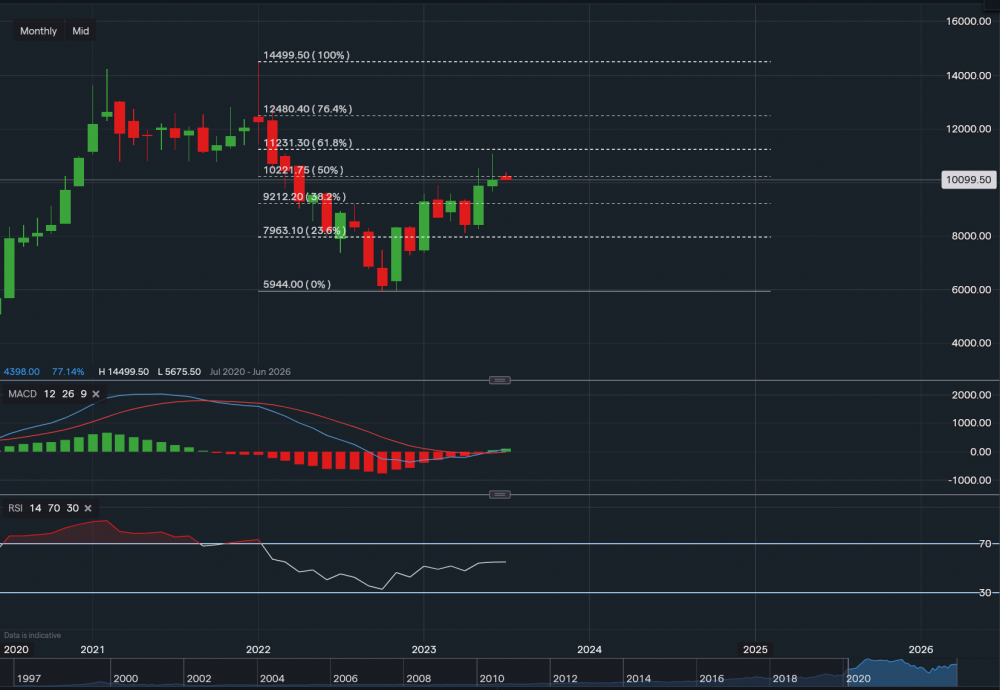
Chart & Data from IG
Taking a look at Taiwan Semiconductor as its stock price is up 35% since the start of January and it is expected to report earnings next week (Thursday 13th). Currently trading at around $100.99 a share, we have applied the Fibonacci retracement to this chart as we are analysing for the longer-term, and therefore, looking at the monthly timeframe. We can see that the price has approached the 50% Fib ($102.21), and so far in July has struggled to move above it. If this rejection continues and the price closes below, we may see a pullback towards to the 38.2% Fib ($92.12) before continuing higher. A break and close above the 50% Fib would be an indication of a clear continuation of this bullish trend. Hence, we would then look at resistance sitting at $112.31 (61.8% Fib) and then $124.80 (76.4%). This is a longer-term outlook and many price fluctuations can occur during the time period. If we look at the technical indicators, we can see that the MACD has turned positive which tends to be a positive sign when identifying bullish trends. The RSI is also now positive as it reads 54.9.

Tradable assets:
Min.Deposit:
Max Leverage:
FCA:

Rating:


