Test- FTSE 100 Kicks Off August on a High as BP and Senior Lead Market Momentum
$11
10 Oct 2025, 13:13
Neutral
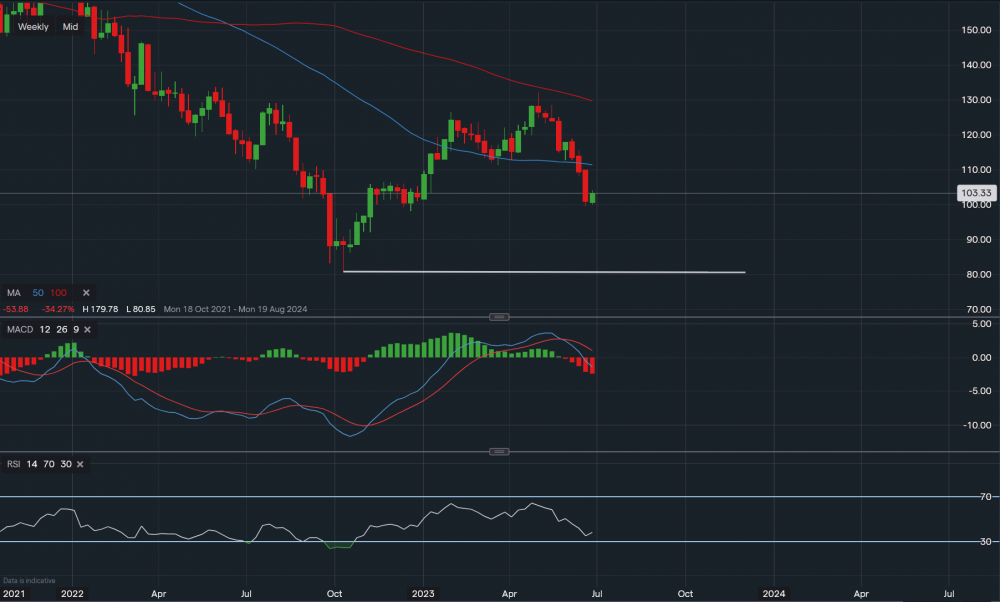
Chart & Data from IG
From a technical perspective, its stock is currently trading at around 1.03p a share. We can see that the price has now fallen below the 50-day moving average on the weekly interval, this week so far has been a little positive compared to the last. However, until we see a clear sign of consolidation the bias remains negative. The price attempted to break higher on the 1st of May, but the resistance along the 100-day MA was overpowering. It then quickly retraced and crashed through prior support levels. It is now approaching the support of 0.98p, a break and close below this price may see a further slide towards the supportive base, or respectively, 0.80p a share. If consolidation occurs around the existing levels, we would then look towards the upside. At present, the resistance sits at 1.01p followed by the previous support level of 1.11 (50-day MA), which is now acting as resistance. A rise and close above the 50-day MA could see another attempt at the 100-day MA. Looking at the technical indicators at the bottom of the chart, MACD is strongly negative and so is the RSI as it reads 37. Though RSI has levelled out slightly. This would suggest that the bias for the time being remains ‘bearish’ or negative.

Tradable assets:
Min.Deposit:
Max Leverage:
FCA:

Rating:


