Test- FTSE 100 Kicks Off August on a High as BP and Senior Lead Market Momentum
$11
10 Oct 2025, 13:13
Neutral
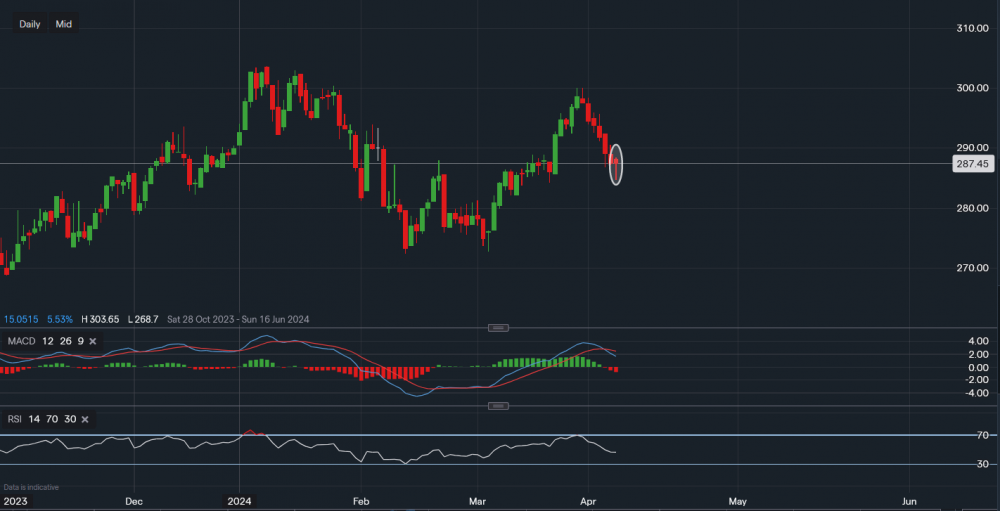
Chart & Data from IG
Tesco’s stock is down just over 1% YTD, and its share price did fall as low as 6% earlier on in the year but recovered some of the losses since. Currently, its stock is trading at around 287p a share. Looking at the daily chart, we can see today’s candlestick touched 284p but buyers are now rushing in ahead of the earnings tomorrow as it seems like a hammer candlestick is forming for the day. This tends to be an indication that buying orders are being filled and volatility is increasing, however, this does not mean that the price will now start rising higher. The support here is clearly the level of 284p, which was tested earlier in the day. A break below this level could lead to a further sell-off towards 282p and maybe even 280p. The near-term bias seems to be shifting towards bearish, although, the earnings results may change this view. The resistance sits at 289p and a break above this level could lead to an extension towards 292p-293p. The technical indicators have faltered somewhat over the course of last week, the MACD is now negative and the RSI is just sitting in a neutral position as it reads 46.

Tradable assets:
Min.Deposit:
Max Leverage:
FCA:

Rating:


