Test- FTSE 100 Kicks Off August on a High as BP and Senior Lead Market Momentum
$11
10 Oct 2025, 13:13
Neutral
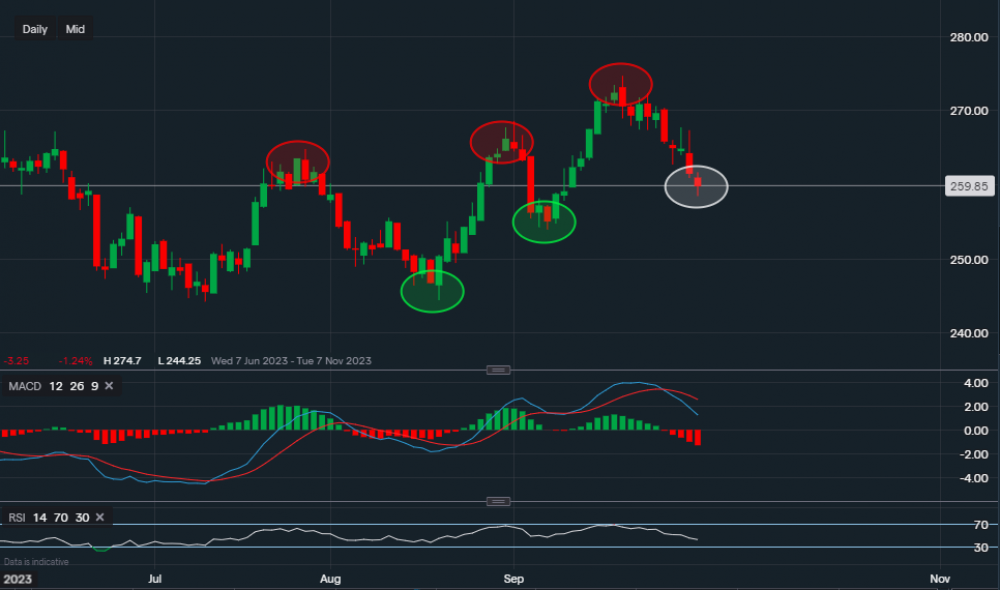
Chart & Data from IG
Taking a look at Tesco shares as the British supermarket chain is releasing earnings tomorrow. Currently, its share price sits around 259p a share. Looking at the chart from a technical perspective on the daily timeframe, we can see that since July the price has been forming higher highs along with higher lows. The higher highs are marked by the red ovals (resistance) and the higher lows are marked by the green ovals (support). This indicates a bullish trend, however, a new higher low has not yet been formed. This creates uncertainty for investors on whether the price continues in the trend. If we see some consolidation around the area marked by the white oval, or above the support of 254p, we could see a continuation of the trend. In that scenario, we would look at resistance levels sitting at 264p then at 268p and then the major level at 274p. On the other hand, if the price breaks below the support of 254p then it might be a signal that the trend has taken a turn. We would then look at support sitting at 249p. Even though the pattern of the trend is bullish, if we look over to the technical indicator, they are suggesting otherwise. The MACD is negative and so is the RSI as it reads 43, therefore, the outlook for Tesco is mixed for the time being. Perhaps the earnings will provide more clarity for investors.

Tradable assets:
Min.Deposit:
Max Leverage:
FCA:

Rating:


