Test- FTSE 100 Kicks Off August on a High as BP and Senior Lead Market Momentum
$11
10 Oct 2025, 13:13
Neutral
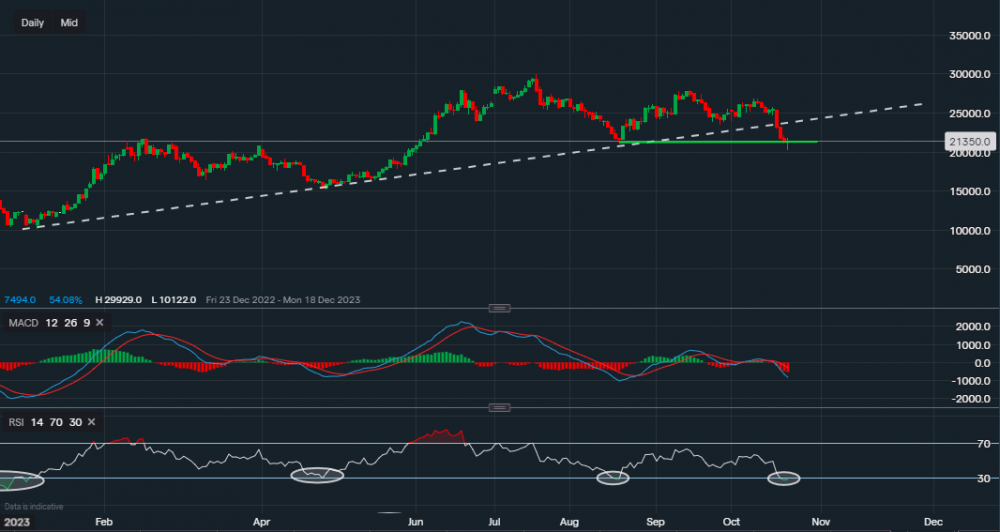
Chart & Data from IG
Taking a look at Tesla as a separate situation as it already reported its earnings last week. The earnings reported came in worse-than-expected and as a result, Tesla shed over 10% of its stock value last week. Now its share price sits around $213.50 a share. The price has approached a key support level of $212.38 (marked by the green trendline), it did break below but has now recovered and trading above. Perhaps some consolidation may attract the bulls for a mini bounce, especially as the RSI is yet again oversold on the daily timeframe (highlighted by the white ovals). Looking at the history of the chart, on the last three occasions when the RSI reached a similar point, the stock managed to gain momentum which led to a bounce higher. However, as the dotted trendline support has been tested and broken, the bias has shifted towards the bears for the near term. It would be unreliable to discuss any resistance levels until signs of consolidation are present. The MACD is in the red once more with rising volume. Definitely one to keep an eye on as upcoming earnings from the megacaps may influence Tesla’s stock (short-term outlook).

Tradable assets:
Min.Deposit:
Max Leverage:
FCA:

Rating:


