Test- FTSE 100 Kicks Off August on a High as BP and Senior Lead Market Momentum
$11
10 Oct 2025, 13:13
Neutral
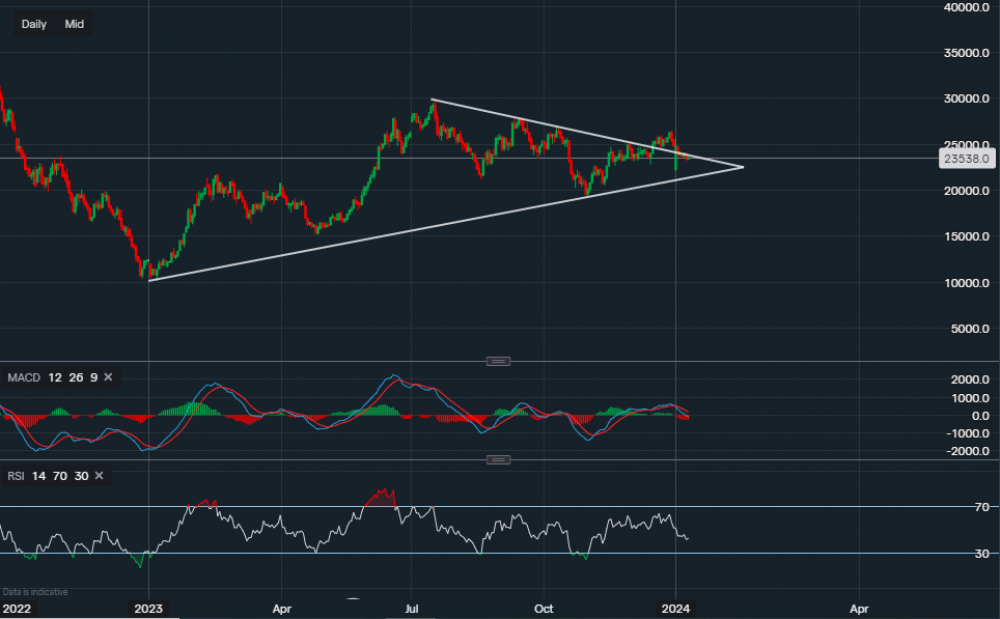
Chart & Data from IG
Taking a look at Tesla on the daily chart as it broke out of the triangle towards the upside back in December, but it has now fallen back into it. Currently, its shares are trading at around $235.38 a share. It seems like the support between $231-$232 is proving to be robust, with various attempts to move below it but so far the stock has held out. A break below this support could indicate a move lower back towards the lower trendline of the triangle, which reads approximately $215-$216. On the other hand, for the bulls, the primary resistance in focus now is the $238 level (along the upper trendline). A break and close above the trendline may suggest that the initial breakout wasn’t false, meaning a push towards the upside would be likely. The targets in focus would be $246.67 then $252.73 and then the key one of $265.10 (December’s high). Nevertheless, the technical indicators do not offer much of an incentive, if anything, they point towards a bearish bias. The MACD is negative and after yesterday’s decline, the RSI is also now negative, reading 42.
 (Chart & Data from IG)

Tradable assets:
Min.Deposit:
Max Leverage:
FCA:

Rating:


